
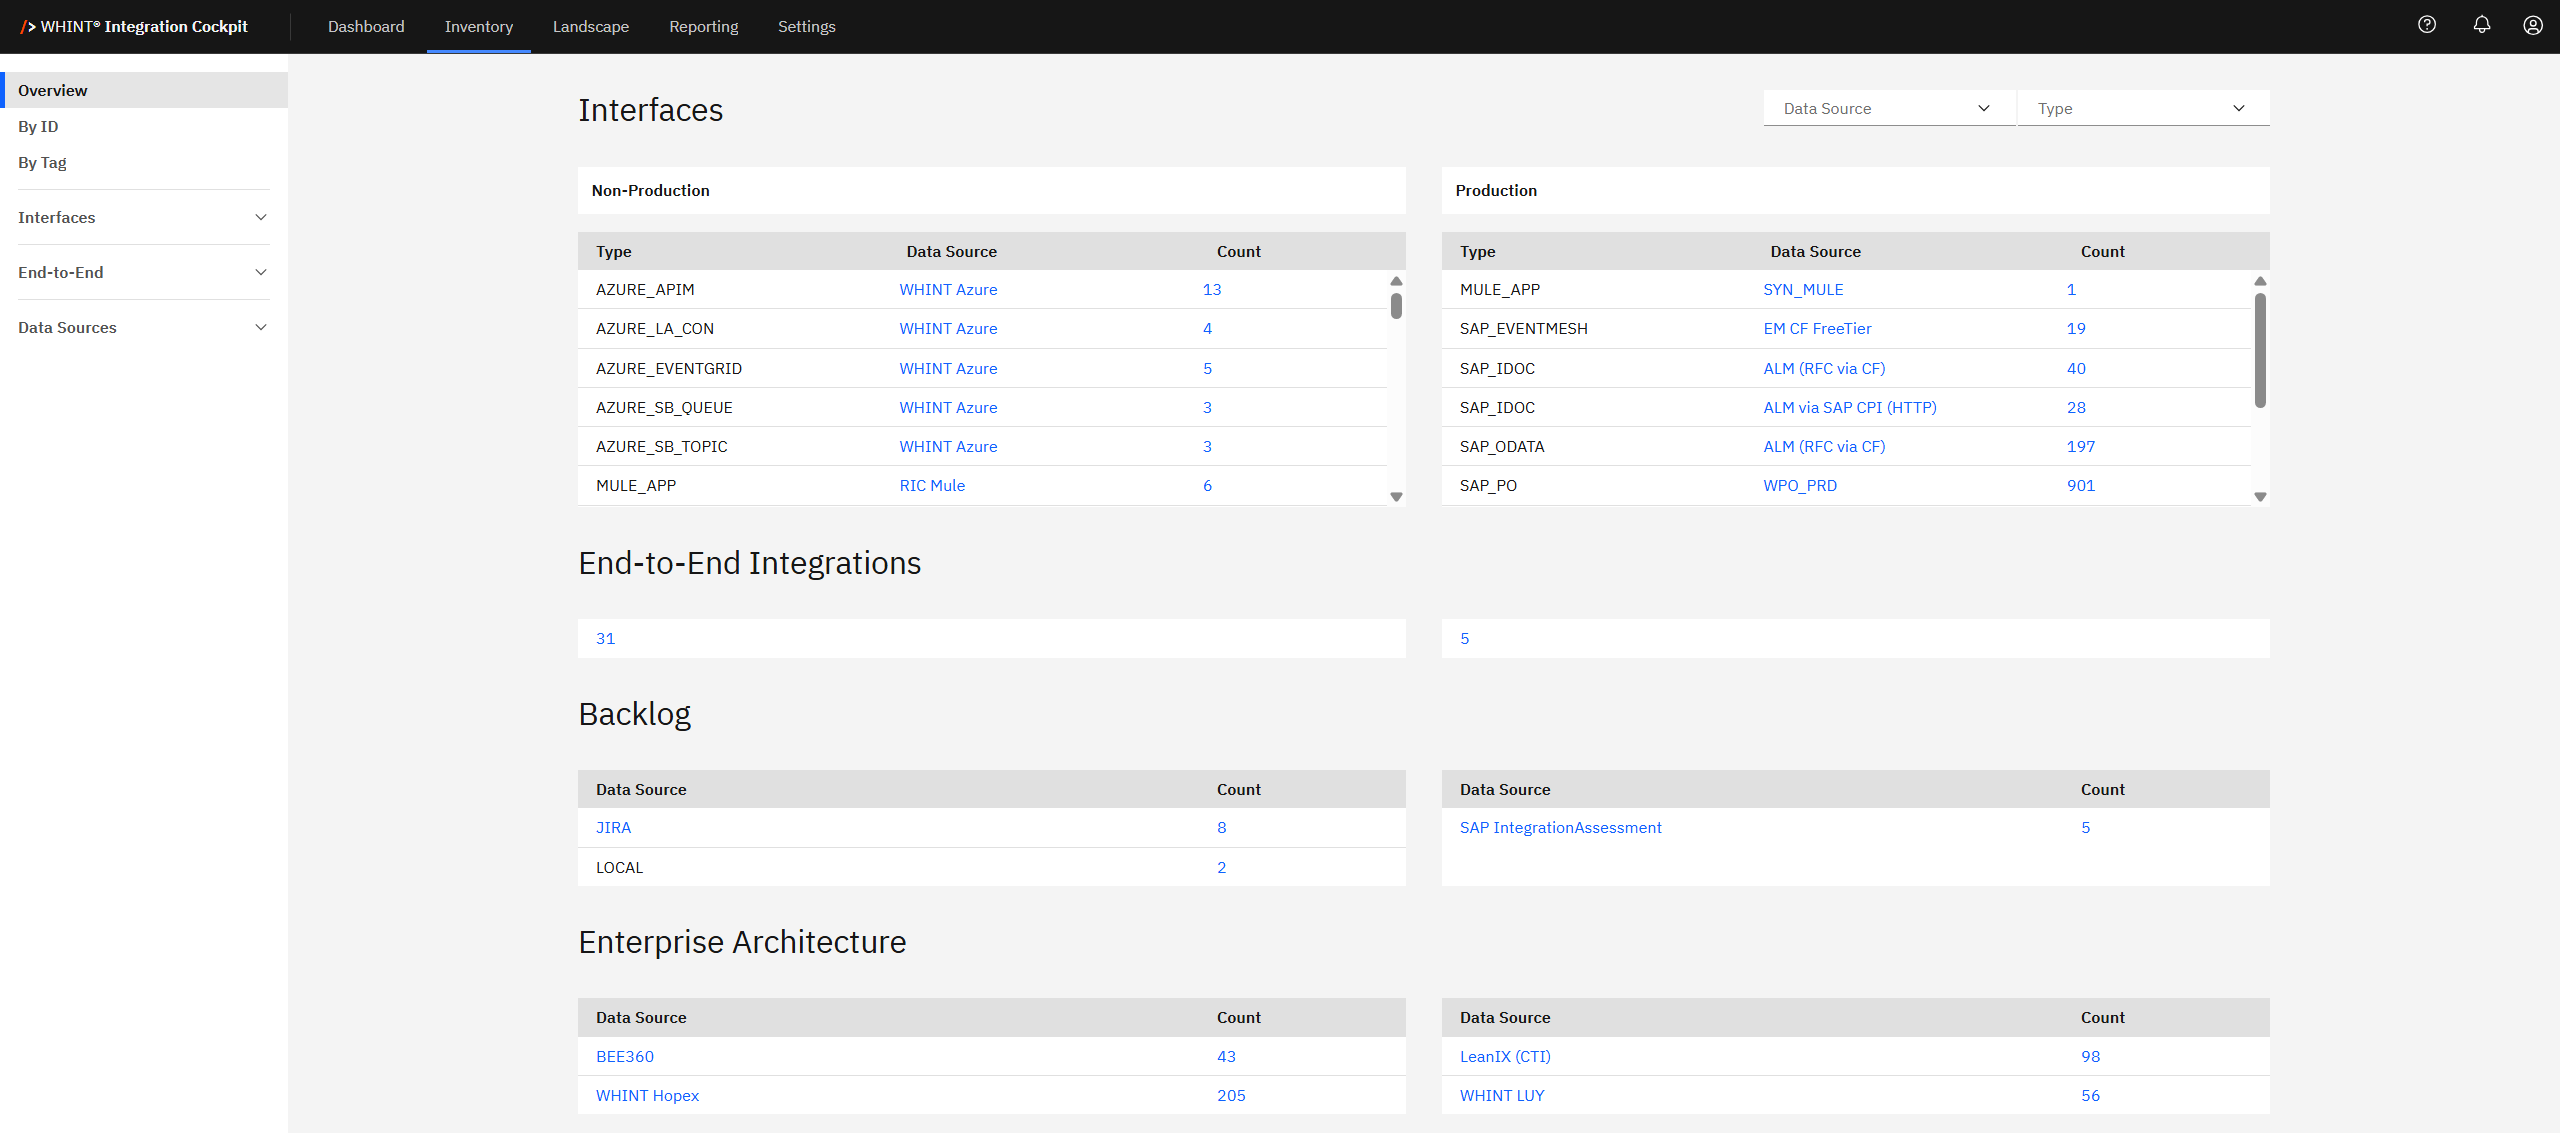
The Inventory Overview provides a consolidated view of all discovered integration content, grouped by environment, interface type and data source.
Use this central dashboard to monitor interface distribution, track integration progress and assess your enterprise architecture landscape.
Navigate to Inventory → Overview in the main navigation to access the overview.
Drill-down Navigation
The Inventory Overview serves as your navigation hub - click any count or data source name to access detailed views with automatic filtering applied.
Interfaces
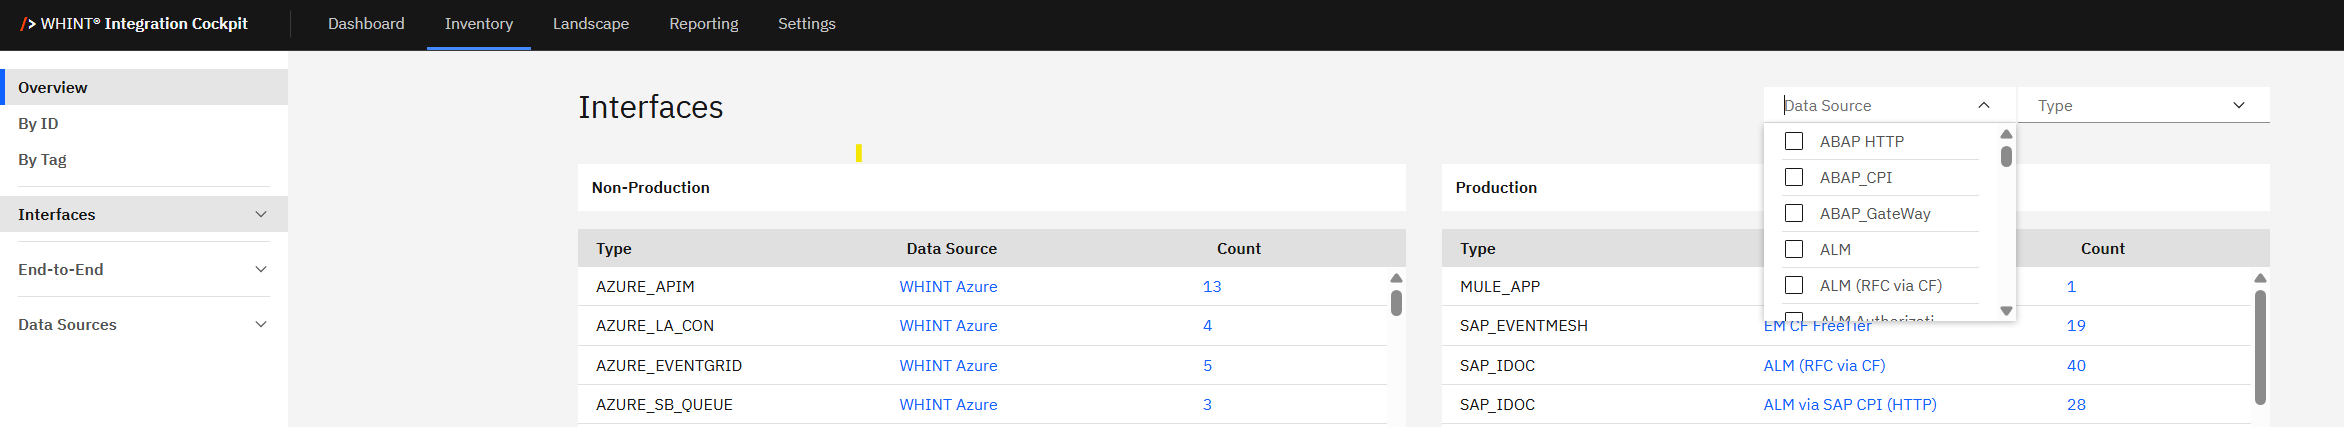
The Interfaces section displays your integration interfaces split between Non-Production (left) and Production (right) environments.
Each table shows:
-
Type: Interface classification (e.g. AZURE_APIM, SAP_EVENTMESH, MULE_APP)
-
Data Source: Connected system or platform name (clickable)
-
Count: Number of active interfaces of this type (clickable)
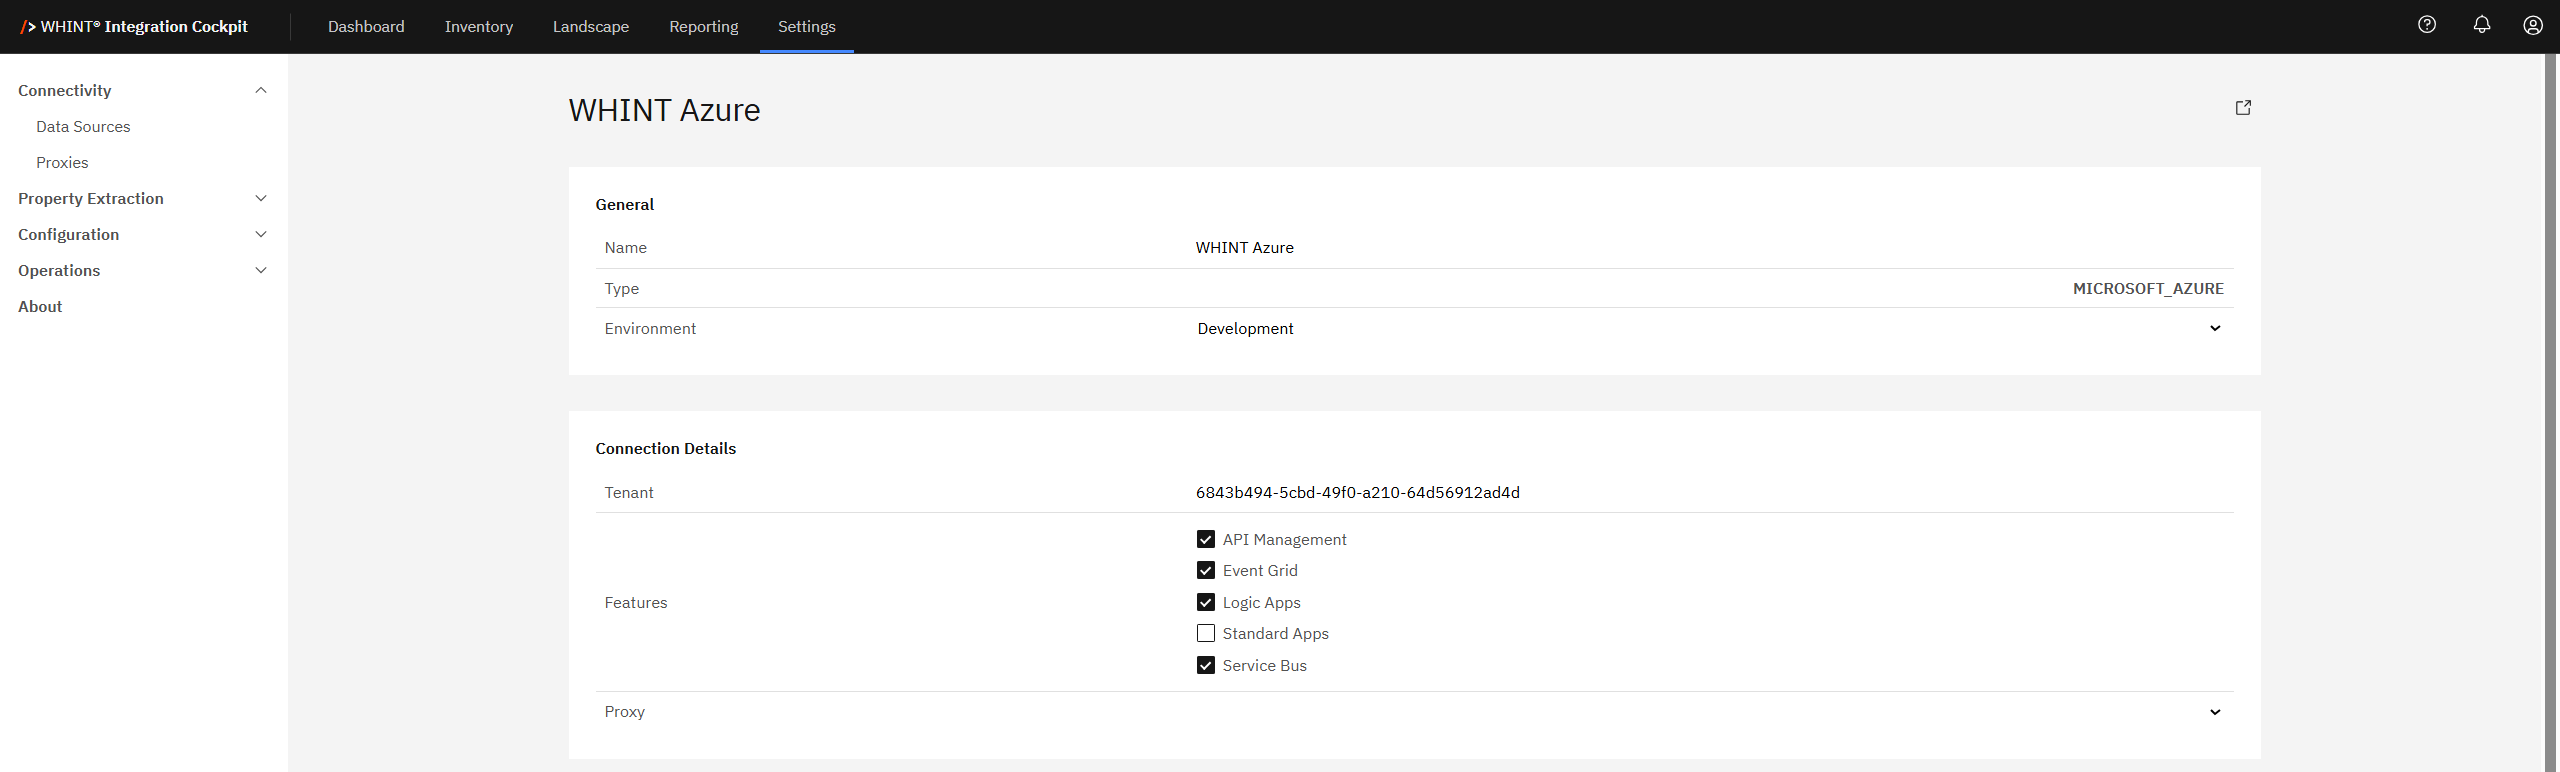
Clicking a Data Source (e.g. "WHINT Azure") navigates to the configured data source setup to show connection details and configuration.
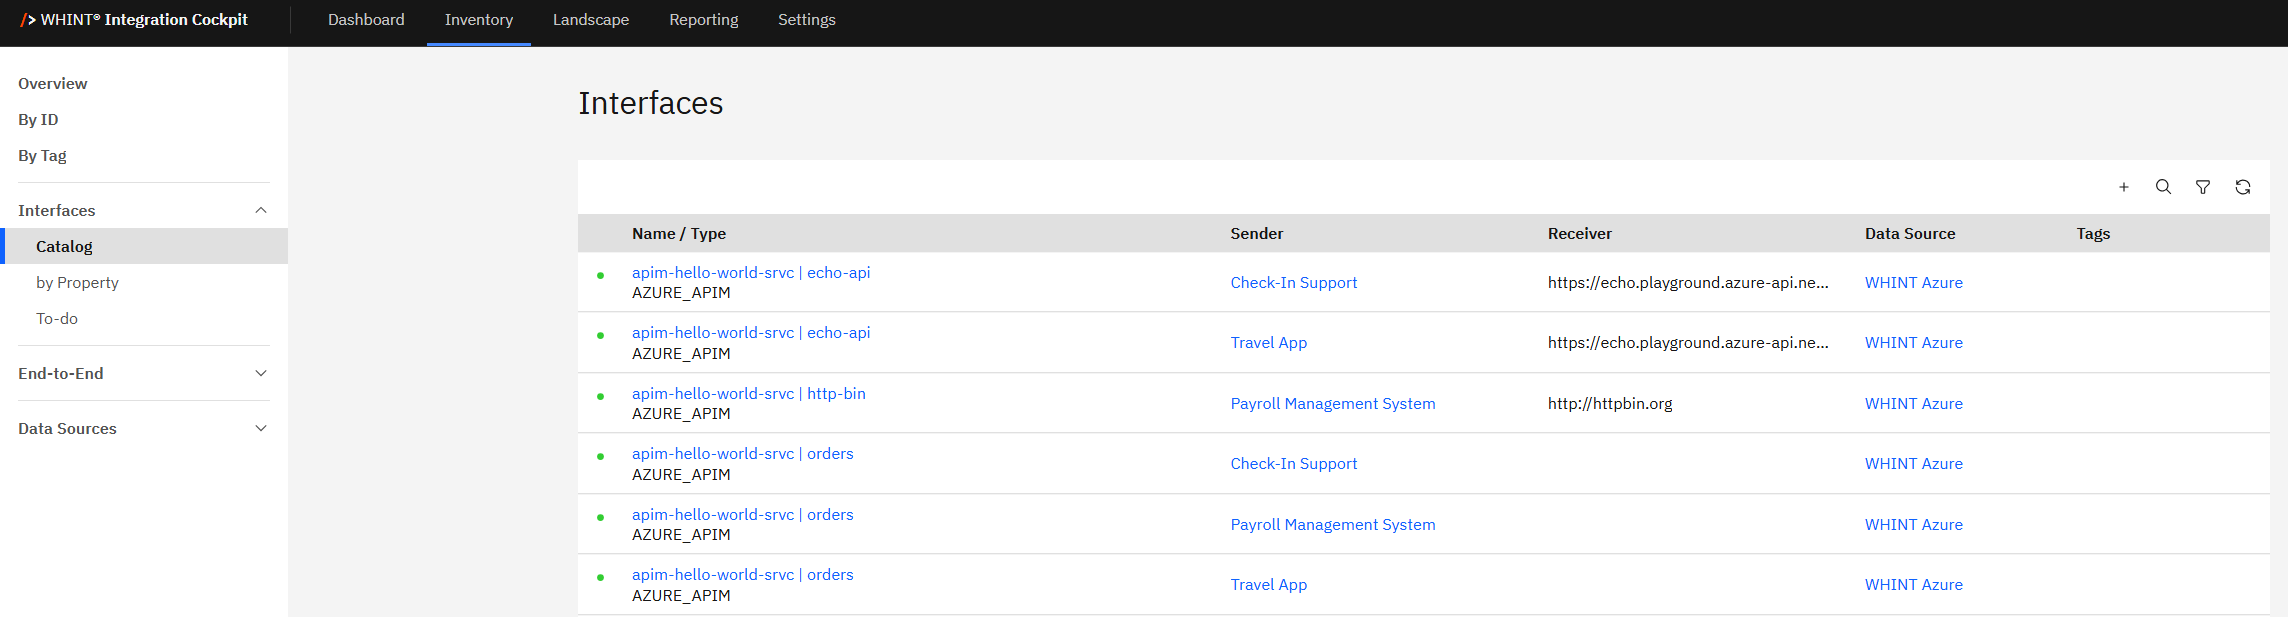
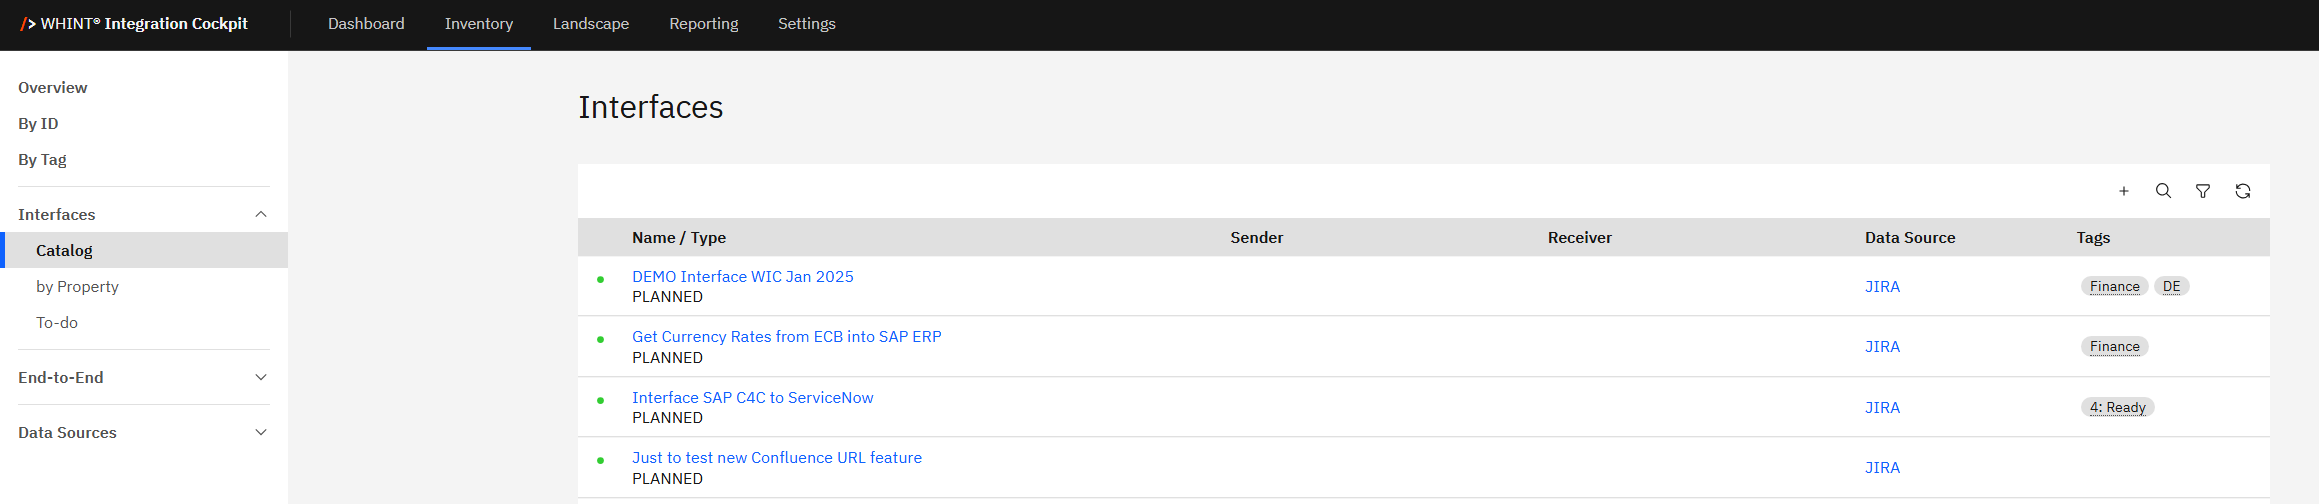
Clicking a Count (e.g. "13") opens Interfaces → Catalog view, pre-filtered by your selection (Type + Data Source), showing detailed interface list with Name, Sender, Receiver, Tags.
End-to-End Integrations
The End-to-End Integrations panel shows your integration flow status:
-
31: Non-production integration flows
-
5: Production integration flows

This represents complete integration chains that span multiple systems and technologies.
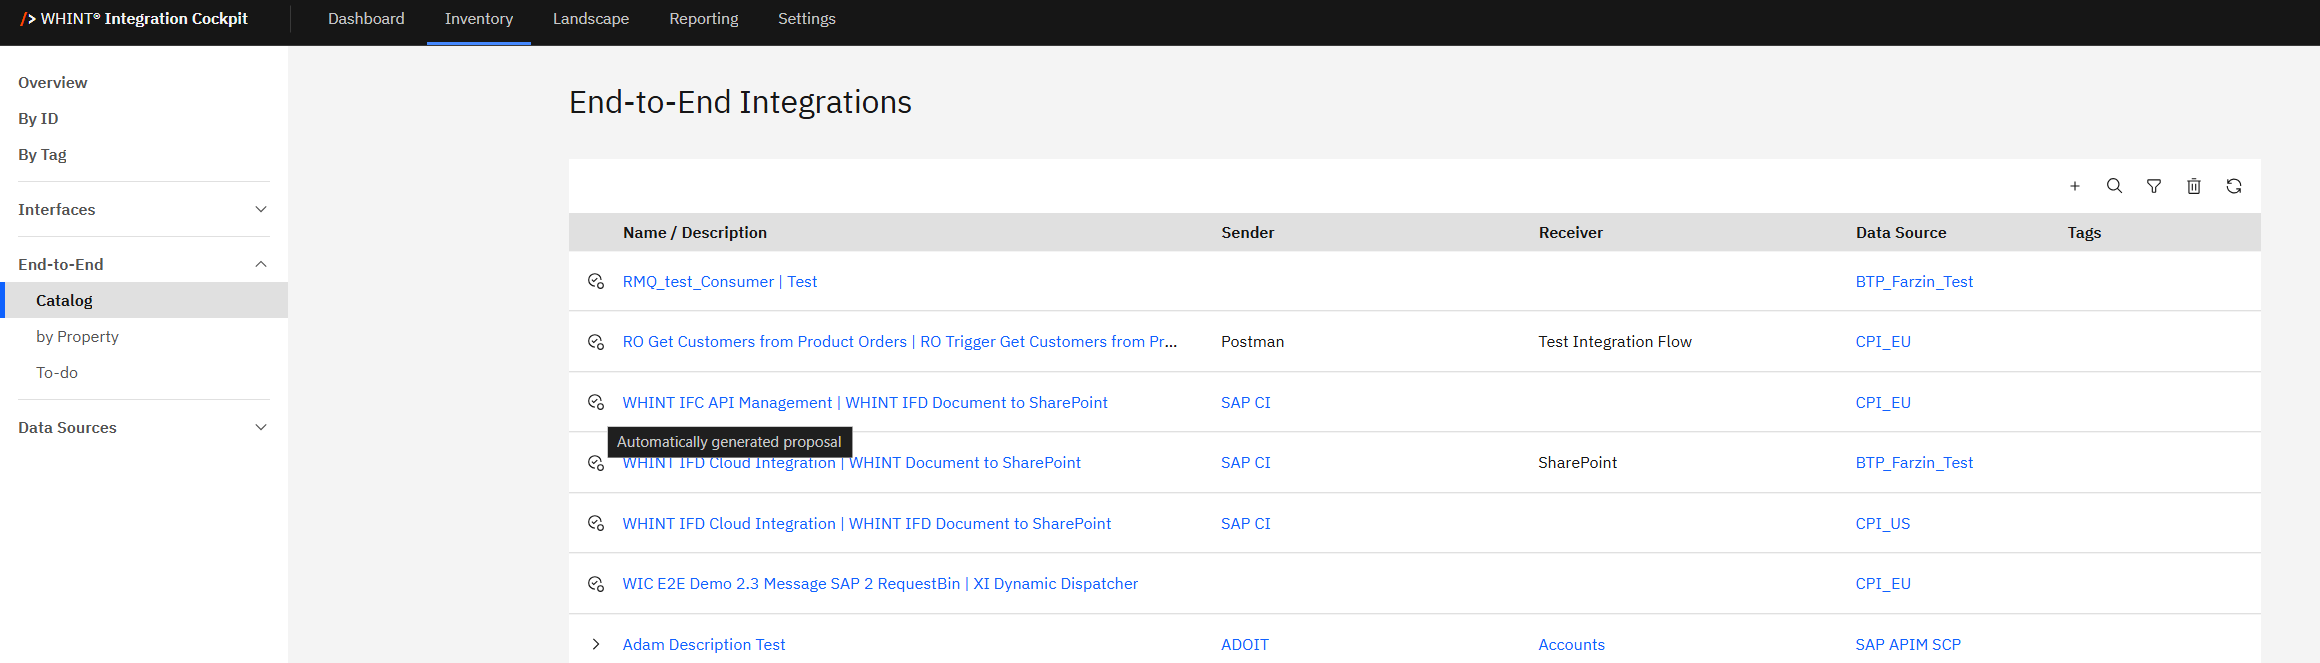
Clicking the count opens End-to-End → Catalog view with automatically generated proposals for End-to-End Integrations, showing complete business process flows and dependencies.
Backlog
The Backlog section shows integration work that's planned but not yet deployed. This helps you track upcoming integration projects and understand your development pipeline.
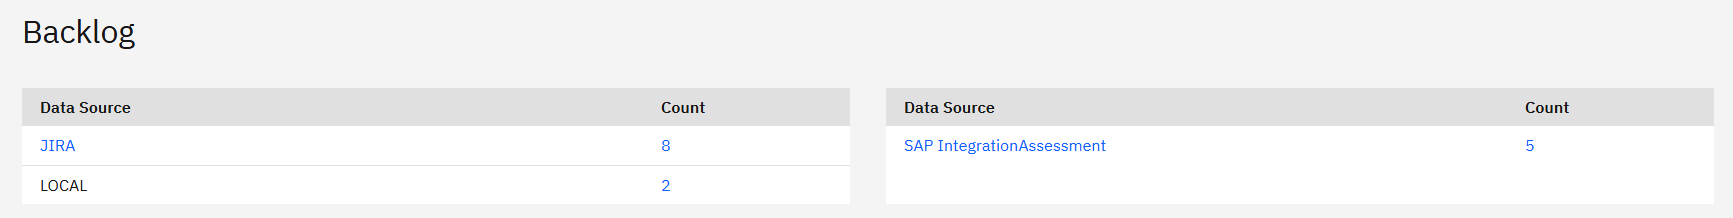
Common backlog sources include JIRA (project management tasks), LOCAL (manually entered items), and SAP IntegrationAssessment (assessment-generated recommendations). Use these counts to monitor your integration planning workload and upcoming releases.
Clicking a Data Source navigates to the configured data source setup to show backlog connection details.
Clicking a Count opens Interfaces → Catalog view, filtered to show backlog items from that source.
Enterprise Architecture
The Enterprise Architecture section displays artifacts imported from your enterprise architecture tools like BEE360 (business processes), WHINT Hopex (architecture repository), LeanIX (application portfolio) and WHINT LUV (integration patterns).
This data helps you understand how your technical integrations align with your broader enterprise architecture strategy and business capabilities.
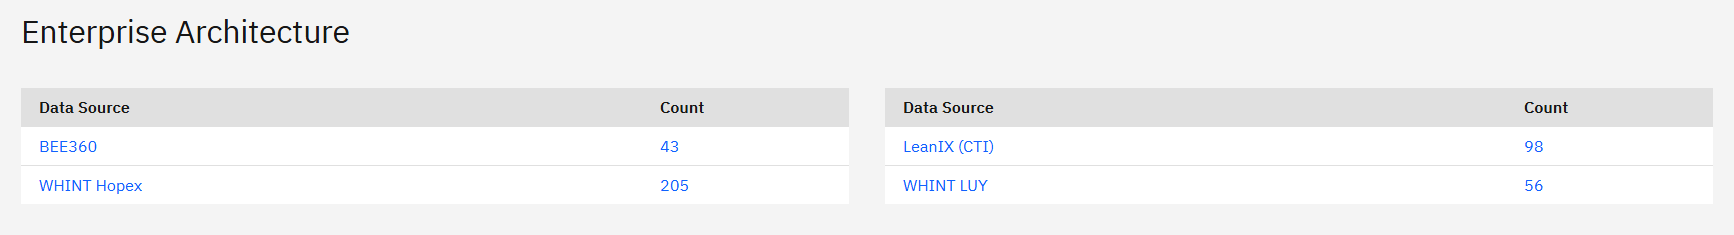
Enterprise Architecture data links technical integration data with your enterprise architecture model.
Filtering and Quick Navigation
Filtering Options
Use the dropdown menus in the top-right corner to narrow your view:
-
Data Source: Filter by specific connected systems
-
Type: Filter by interface or object types
Quick Navigation
From the Overview, you can quickly navigate to:
-
By ID: Specific interface lookup
-
By Tag: Category-based browsing
-
Interfaces: Complete interface catalog
-
End-to-End: Integration flow analysis
-
Data Sources: Source configuration management
Last Updated: August 15, 2025