
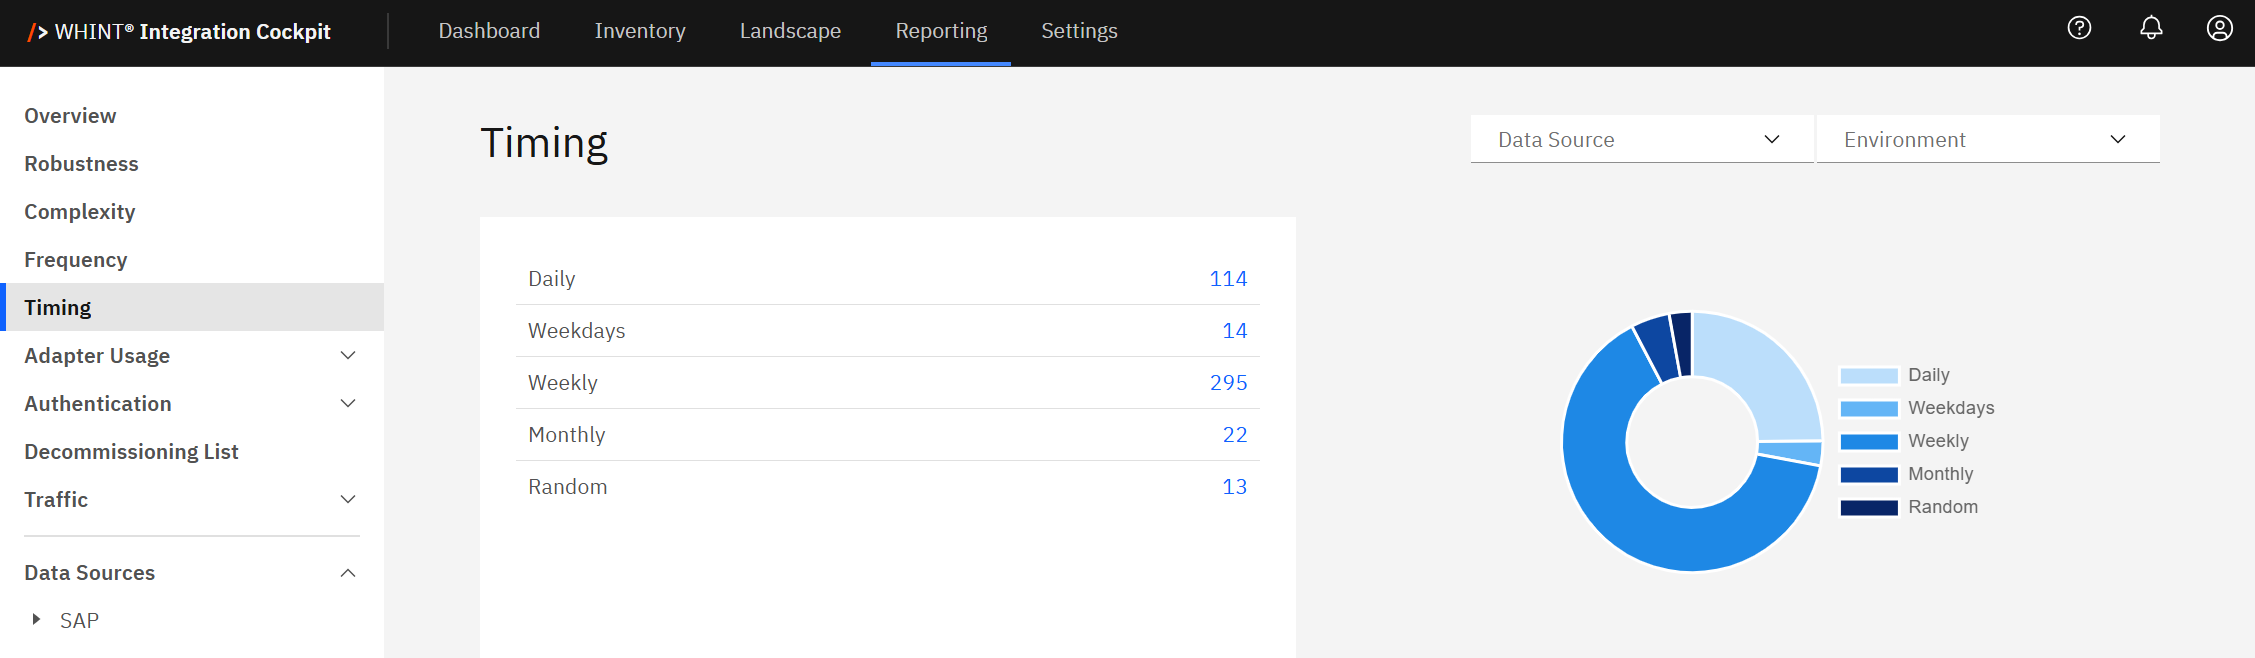
The Timing view shows when your interfaces are scheduled to execute, providing insights into scheduling patterns and resource distribution across different time intervals. Use this analysis to optimize scheduling, identify resource conflicts, and balance workload distribution.
Navigate to Reporting → Timing to access interface scheduling analytics with interactive pie chart visualization and filtering capabilities.
Timing Overview
Timing shows when interfaces are scheduled to execute, helping you understand scheduling patterns and optimize resource allocation across different time intervals.
What you see:
-
Interface distribution table with timing categories and clickable blue count numbers
-
Interactive pie chart with hoverable segments showing exact counts
-
Data Source filter to analyze specific integration platforms
-
Environment filter to switch between Production, Test, Development views
Using Timing Categories
Timing classification automatically categorizes interfaces into five levels based on their scheduled execution patterns:
|
Timing Level |
Description |
Business Impact |
|---|---|---|
|
Daily |
Interfaces scheduled to run every day |
High resource usage, consistent daily processing |
|
Weekdays |
Interfaces scheduled only on business days |
Business process alignment, weekend resource savings |
|
Weekly |
Interfaces scheduled to run weekly |
Batch processing, periodic data synchronization |
|
Monthly |
Interfaces scheduled to run monthly |
Long-term reporting, monthly business cycles |
|
Random |
Interfaces with irregular or event-driven schedules |
Ad-hoc processing, event-based triggers |
How to use the interface counts:
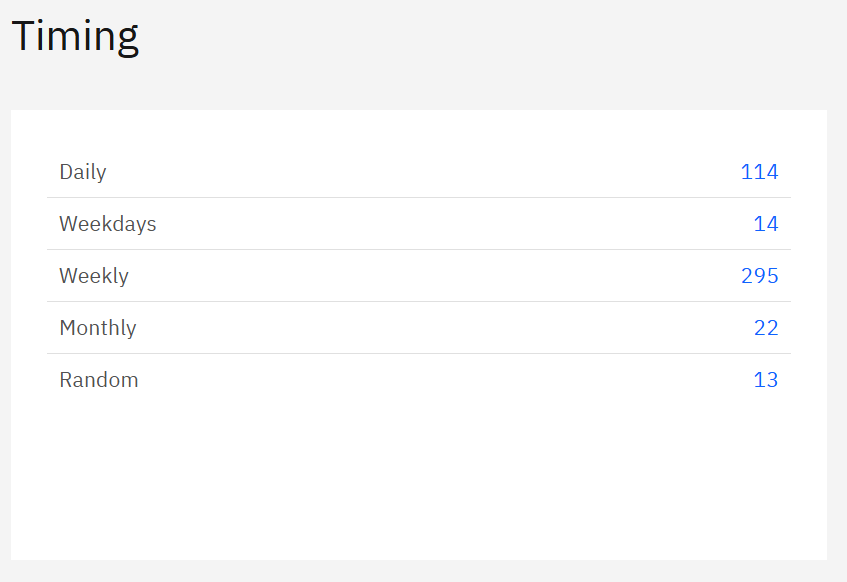
Click blue interface count numbers to filter and view specific interfaces:
-
Click "114" (Daily) → Shows interfaces running every day that may need resource optimization
-
Click "14" (Weekdays) → Displays business-day-only interfaces for workload planning
-
Click "295" (Weekly) → Lists weekly batch processes for scheduling coordination
-
Click "22" (Monthly) → Shows monthly processes for long-term planning
-
Click "13" (Random) → Displays event-driven interfaces for monitoring
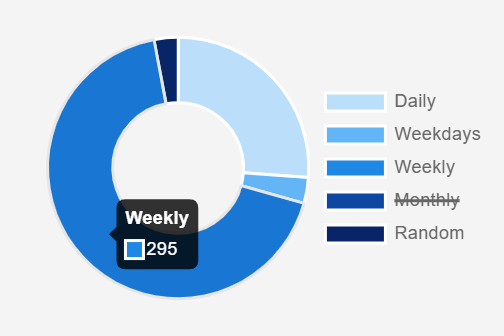
Interactive pie chart features:
-
Hover over segments to see exact interface counts (e.g. "Weekly: 295")
-
Click pie chart segments for same filtering as blue numbers
-
Click legend items (Daily, Weekdays, Weekly, Monthly, Random) to strike out and filter out those categories from the view
-
Visual distribution shows scheduling balance across your landscape
Navigation workflow:
-
Assess scheduling distribution - Use pie chart hover to see exact counts per timing category
-
Investigate high-frequency schedules - Click blue numbers "114" (Daily) first to review resource-intensive schedules
-
Review batch processing - Click "295" (Weekly) to optimize batch scheduling windows
-
Plan maintenance windows - Use timing data to identify low-activity periods
Timing (Selected)
When you click any blue timing count, you'll see the Interfaces table filtered to show only interfaces matching that timing category.
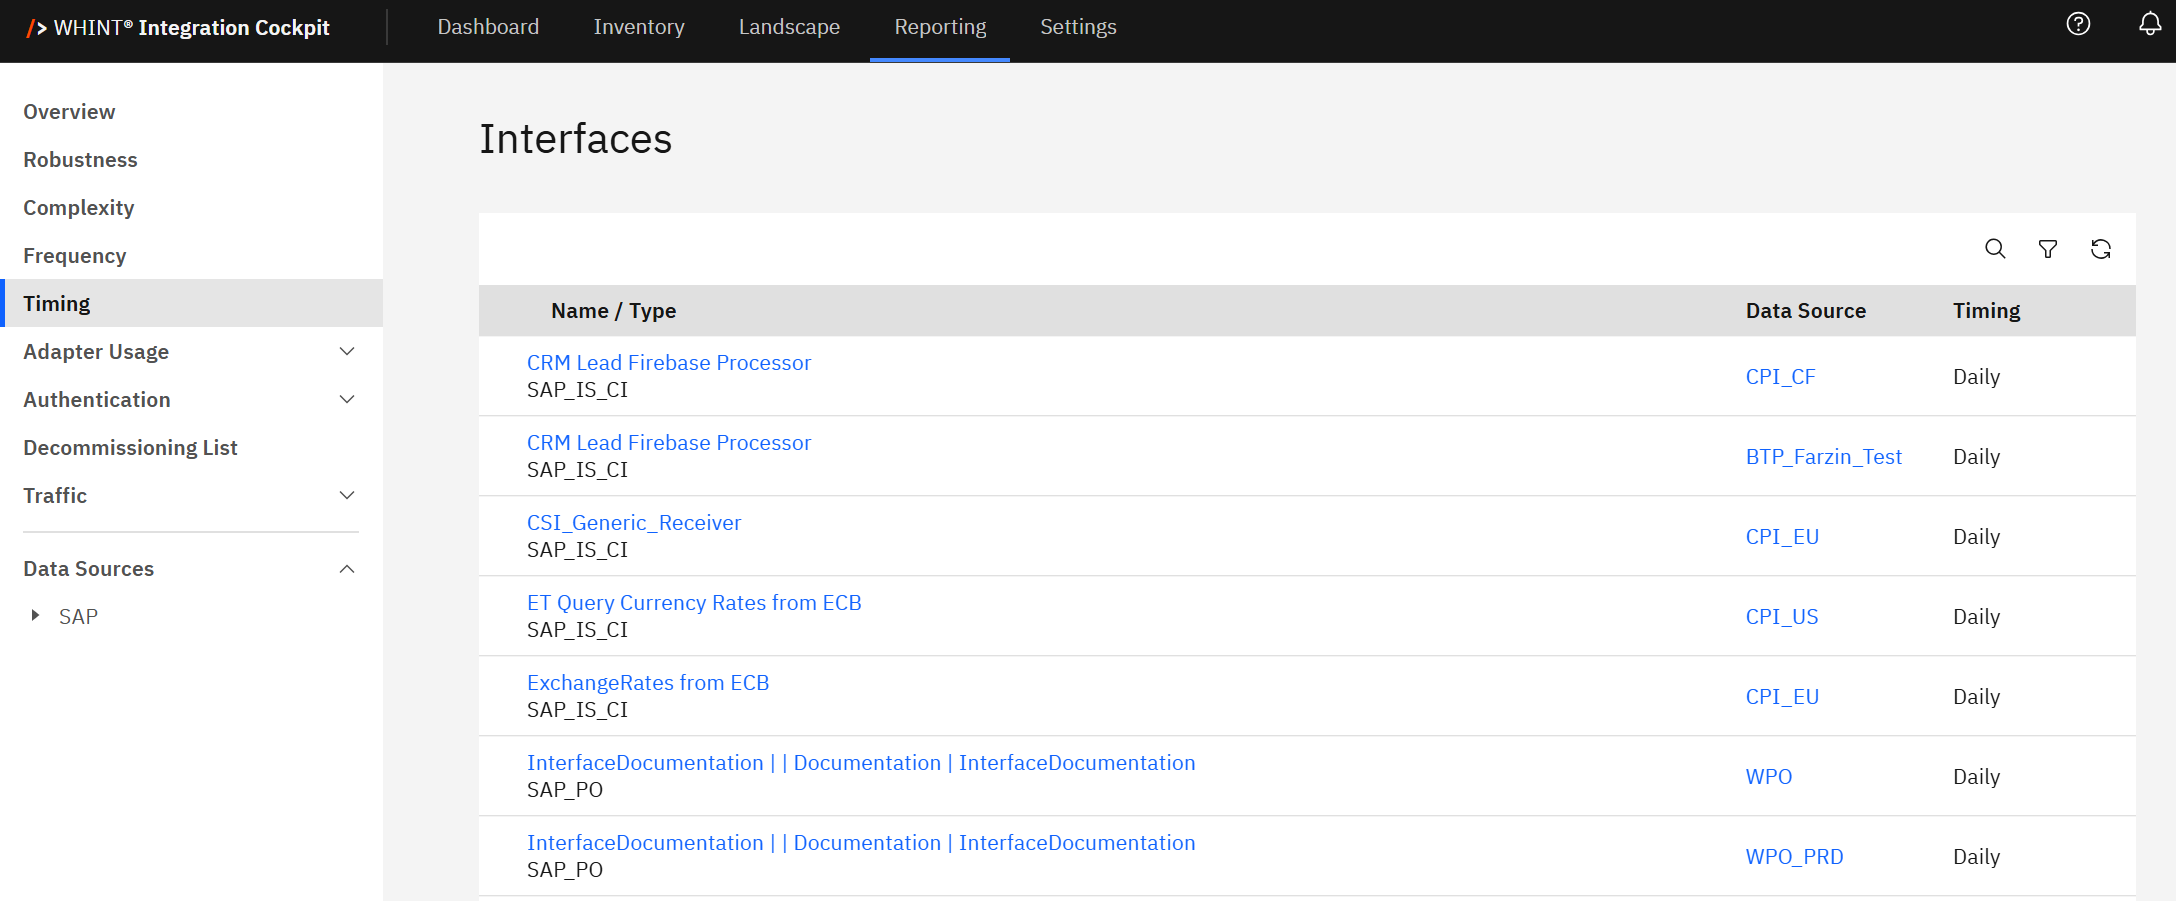
What you see after clicking:
-
Filtered interface list showing only interfaces with the selected timing (e.g. Daily)
-
Interface details including Name/Type, Data Source and Timing confirmation
-
Search and filter controls to further refine the results
-
Sortable columns for organizing the interface list
Use the filtered view to:
-
Review specific interfaces within each timing category
-
Identify scheduling conflicts by examining interfaces with the same timing
-
Plan maintenance windows by understanding which interfaces run when
-
Optimize resource allocation based on timing patterns
Click the browser back button or navigate to Reporting → Timing to return to the timing overview.
Timing Insights
Ideal distribution: Balanced scheduling across different intervals with clear separation between real-time (Daily) and batch processing (Weekly/Monthly) workloads.
High daily concentration: Many Daily interfaces may indicate potential for resource optimization and scheduling conflicts during peak hours.
Recommended actions:
-
Daily interfaces: Monitor for resource conflicts, consider staggered execution times
-
Weekly/Monthly interfaces: Optimize batch windows, coordinate maintenance schedules
-
Random interfaces: Ensure proper monitoring and alerting for event-driven processes
Scheduling patterns:
-
Daily interfaces may benefit from load distribution across different hours
-
Weekly interfaces often represent the largest batch processing workload
-
Use timing data to plan maintenance windows during low-activity periods (fewer Daily/Weekdays interfaces)
Timing Analysis Benefits:
Timing classification helps you:
-
Optimize resource allocation by understanding when interfaces execute
-
Plan maintenance windows during periods with fewer scheduled interfaces
-
Identify scheduling conflicts where too many interfaces run simultaneously
-
Balance workload distribution across different time periods
-
Coordinate batch processing to avoid resource contention
Understanding timing patterns enables better infrastructure planning and reduces the risk of performance issues during peak execution periods.
Last Updated: August 22, 2025