
The Complexity view shows how technically complicated your interfaces are within the integration landscape. Use this analysis to identify interfaces that may become bottlenecks, support simplification efforts, and improve overall maintainability by reducing unnecessary complexity.
Navigate to Reporting → Complexity to access interface complexity analytics with interactive pie chart visualization and filtering capabilities.
Want to understand how complexity scores work?
See Dashboard Overview - Complexity for calculation details.
Complexity Overview
Complexity shows how technically complicated an interface is based on various factors such as the number of connected systems, types of adapters used, and whether mapping logic or transformations are involved.
What you see:
-
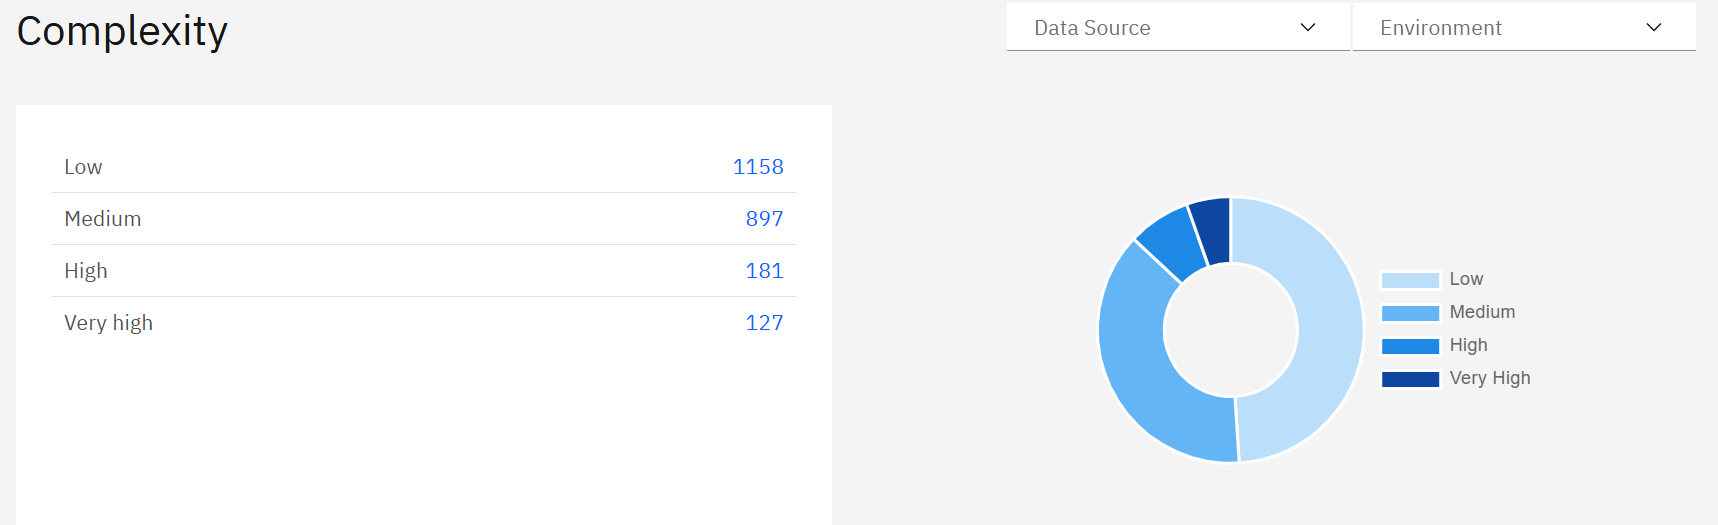
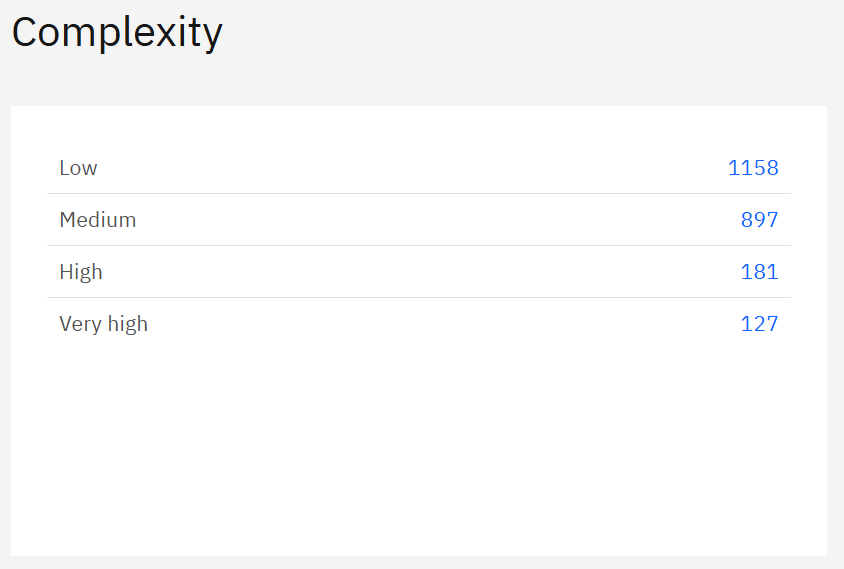
Interface distribution table with complexity categories and clickable blue count numbers
-
Interactive pie chart with hoverable segments showing exact counts
-
Data Source filter to analyze specific integration platforms
-
Environment filter to switch between Production, Test, Development views
Using Complexity Categories
Complexity classification automatically categorizes interfaces into four levels based on technical factors:
|
Complexity Level |
Description |
Business Impact |
|---|---|---|
|
Low |
Simple pass-through interfaces with minimal logic |
Easy to maintain, fast to adapt, highly reliable |
|
Medium |
Moderate complexity with basic transformations |
Manageable maintenance, good stability |
|
High |
Complex interfaces with multiple systems/mappings |
Requires specialized knowledge, higher maintenance |
|
Very High |
Highly complex with extensive logic and connections |
Potential bottlenecks, consider simplification |
How to use the interface counts:
Click blue interface count numbers to filter and view specific interfaces:
-
Click "1158" (Low) → Shows simple interfaces to use as design templates
-
Click "897" (Medium) → Displays moderately complex interfaces for standard patterns
-
Click "181" (High) → Lists complex interfaces that may need optimization
-
Click "127" (Very High) → Shows highly complex interfaces requiring review
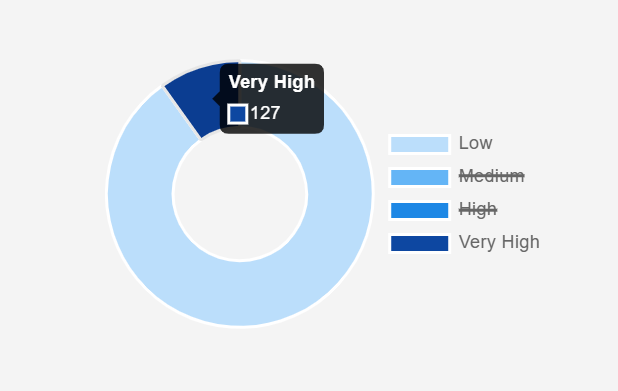
Interactive pie chart features:
-
Hover over segments to see exact interface counts (e.g. "Very High: 127")
-
Click pie chart segments for same filtering as blue numbers
-
Click legend items (Low, Medium, High, Very High) to strike out and filter out those categories from the view (e.g. “Medium” and “High” in this example)
-
Visual distribution shows complexity balance across your landscape
Navigation workflow:
-
Assess overall distribution - Use pie chart hover to see exact counts per category
-
Investigate high complexity - Click blue numbers "181" (High) and "127" (Very High) first
-
Analyze specific interfaces - Review interfaces that may need simplification
-
Use simple patterns - Click "1158" (Low) to identify reusable design patterns
Complexity Insights
Ideal distribution: Large portion in Low/Medium categories with manageable High/Very High interfaces indicates well-designed architecture.
High complexity concentration: Many High/Very High interfaces suggest need for simplification efforts and may indicate technical debt.
Recommended actions:
-
Low/Medium interfaces: Use as design templates and success patterns
-
High/Very High interfaces: Review for simplification opportunities, especially during platform migrations
Platform-specific patterns:
-
SAP Cloud Integration: Based on BPMN elements and transformations (Low: <5 elements, Very High: >30 elements)
-
API Management: Based on policy count (Low: <2 policies, Very High: >10 policies)
-
Use Data Source filtering to compare technology stacks and identify optimization opportunities
Complexity Calculation Details
Complexity scoring varies by integration platform and considers factors such as:
-
BPMN elements count (for SAP Cloud Integration)
-
Policy count (for API Management platforms)
-
Mapping and routing logic (for Process Orchestration)
-
Transformation complexity (XSLT, Message Mapping)
For complete classification criteria by platform, see Dashboard Overview - Complexity.
Related Documentation
For comprehensive complexity analysis and platform-specific details:
-
Dashboard Overview - Complexity - Complete methodology and classification criteria by platform
Last Updated: August 22, 2025