
The SAP Process Orchestration section provides comprehensive traffic analytics and message monitoring for your integration configurations and interface processing.
This reporting helps organizations track integration performance, monitor message volumes, identify processing bottlenecks, and ensure optimal service delivery across enterprise integration landscapes with detailed visibility into communication channels and integrated configurations.
Navigate to Reporting → Data Sources → SAP → Process Orchestration → <Data Source Name> → <Business System> → Traffic to access these analytics views.
Message Count & Performance
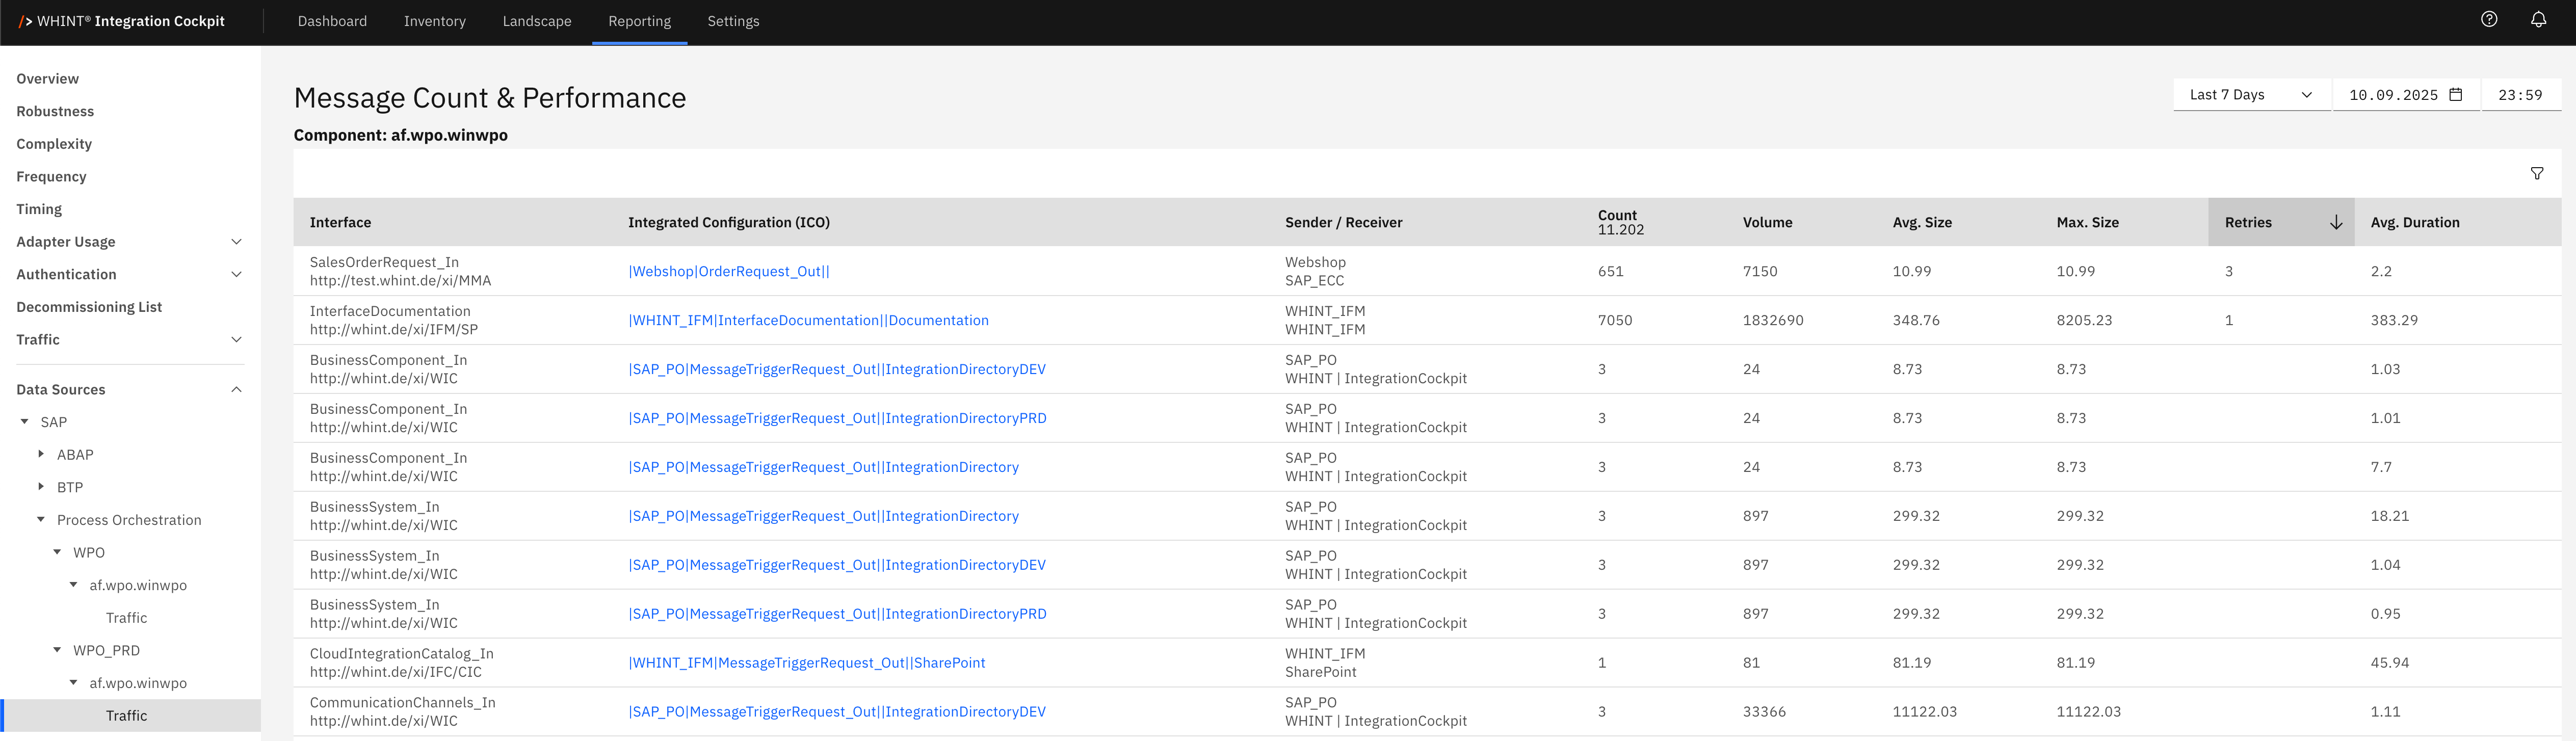
The Message Count & Performance view displays traffic analytics and operational metrics for integrated configurations including message processing volumes, performance measurements, and communication patterns. This view helps you monitor interface traffic, identify high-volume processing, track message sizes, and analyze response times for capacity planning and performance optimization.
What you see:
-
Interface: Integration interface identifier that processes messages (clickable)
-
Integrated Configuration (ICO): Runtime configuration object linking sender and receiver (clickable)
-
Sender / Receiver: Source and target systems participating in the integration
-
Count: Total number of messages processed during the selected time period
-
Volume: Total data volume processed in bytes
-
Avg. Size: Average message size in bytes
-
Max. Size: Maximum message size encountered
-
Retries: Number of retry attempts for failed messages
-
Avg. Duration: Average processing time for message completion
Integrated Configuration Detail View
Clicking an integrated configuration name opens a detailed view showing:
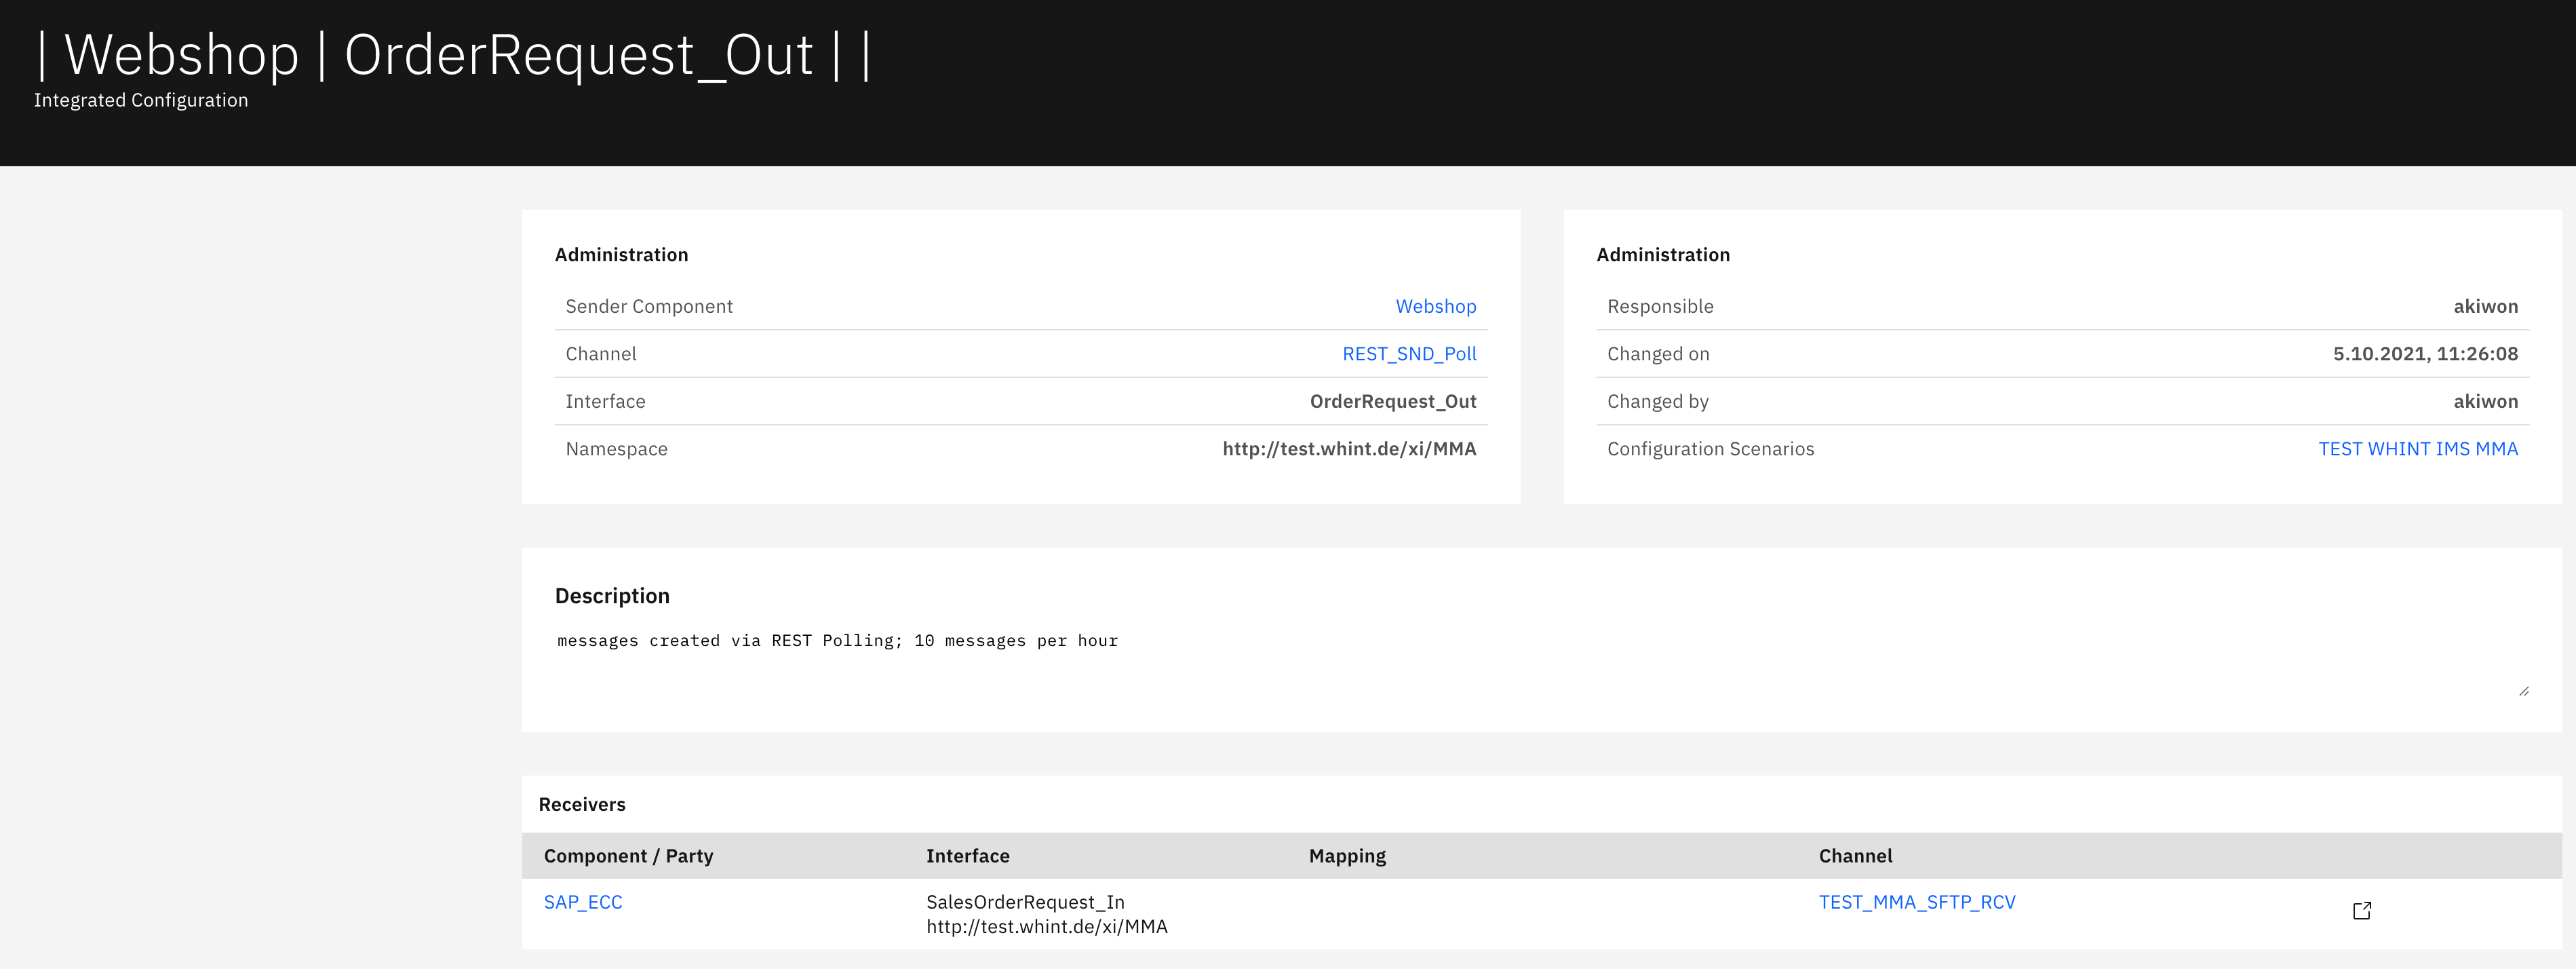
Administration section displays:
-
Sender Component: Source system identifier (Webshop)
-
Channel: Communication channel identifier (REST_SND_Poll) (clickable)
-
Interface: Interface name for message processing (OrderRequest_Out)
-
Namespace: Interface namespace URL identifier
-
Responsible: User responsible for configuration management (akiwon)
-
Changed on: Last modification timestamp
-
Changed by: User who last modified the configuration (akiwon)
-
Configuration Scenarios: Associated configuration scenarios (TEST WHINT IMS MMA) (clickable)
Description section displays:
-
Functional description of the integration configuration including message creation details, polling frequency, and processing specifications
Receivers section displays:
-
Component / Party: Target system component identifier (SAP_ECC) (clickable)
-
Interface: Receiving interface name (SalesOrderRequest_In)
-
Mapping: Message transformation mapping identifier
-
Channel: Communication channel for message delivery (TEST_MMA_SFTP_RCV) (clickable)
Navigation
Analytics views include:
-
Component filters for focused system-specific reporting
-
Time range selection for historical message analysis
-
Volume and performance metrics for capacity planning insights
-
Search and refresh capabilities for real-time monitoring updates
-
Drill-down navigation through blue-highlighted interface and configuration names
-
Channel-level details showing communication adapter configurations
Last Updated: September 10, 2025