
The ABAP Reporting section provides real-time traffic monitoring and performance analytics for SAP integration components. This reporting helps organizations monitor message volumes, track processing success rates, identify performance bottlenecks, and ensure reliable data exchange across enterprise integration landscapes through comprehensive traffic analytics and status monitoring.
Navigate to Reporting → Data Sources → SAP → ABAP → <Data Source Name> to access these traffic monitoring reports.
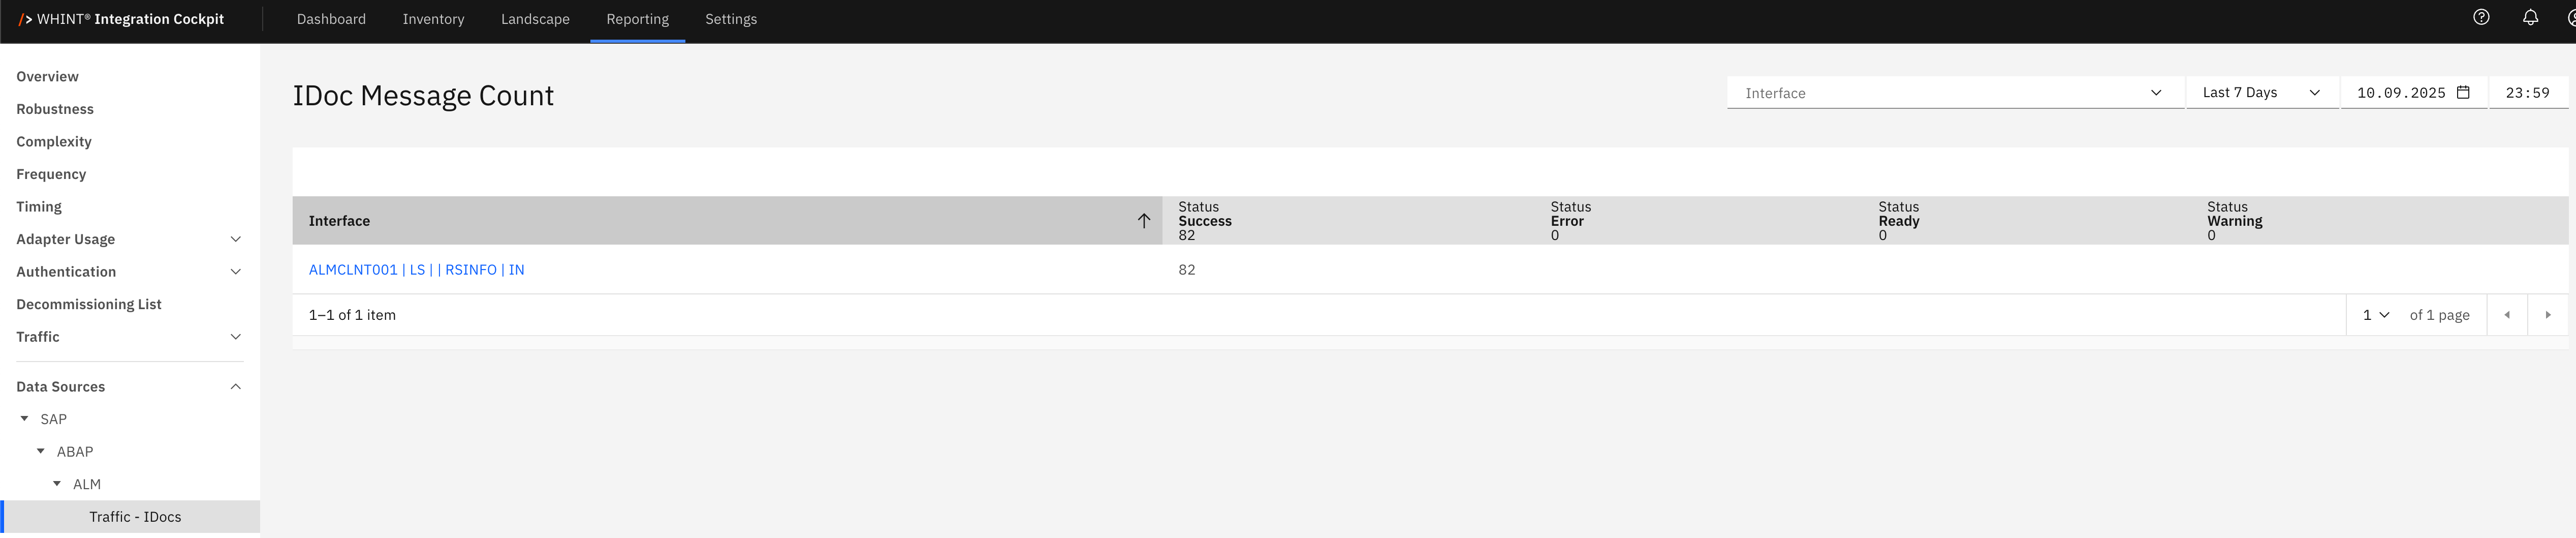
IDoc Message Count
The IDoc Message Count report displays traffic volume and processing status for IDoc (Intermediate Document) messages flowing between SAP and external systems. This view helps you monitor EDI communication performance, track B2B integration success rates and identify processing issues for reliable business document exchange.
What you see:
-
Interface: IDoc interface identifier (clickable)
-
Status Success: Number of successfully processed IDocs
-
Status Error: Number of failed IDoc processing attempts
-
Status Ready: Number of IDocs waiting for processing
-
Status Warning: Number of IDocs with processing warnings
Interface Detail View
Clicking an interface name opens the interface configuration view in the Inventory section showing:
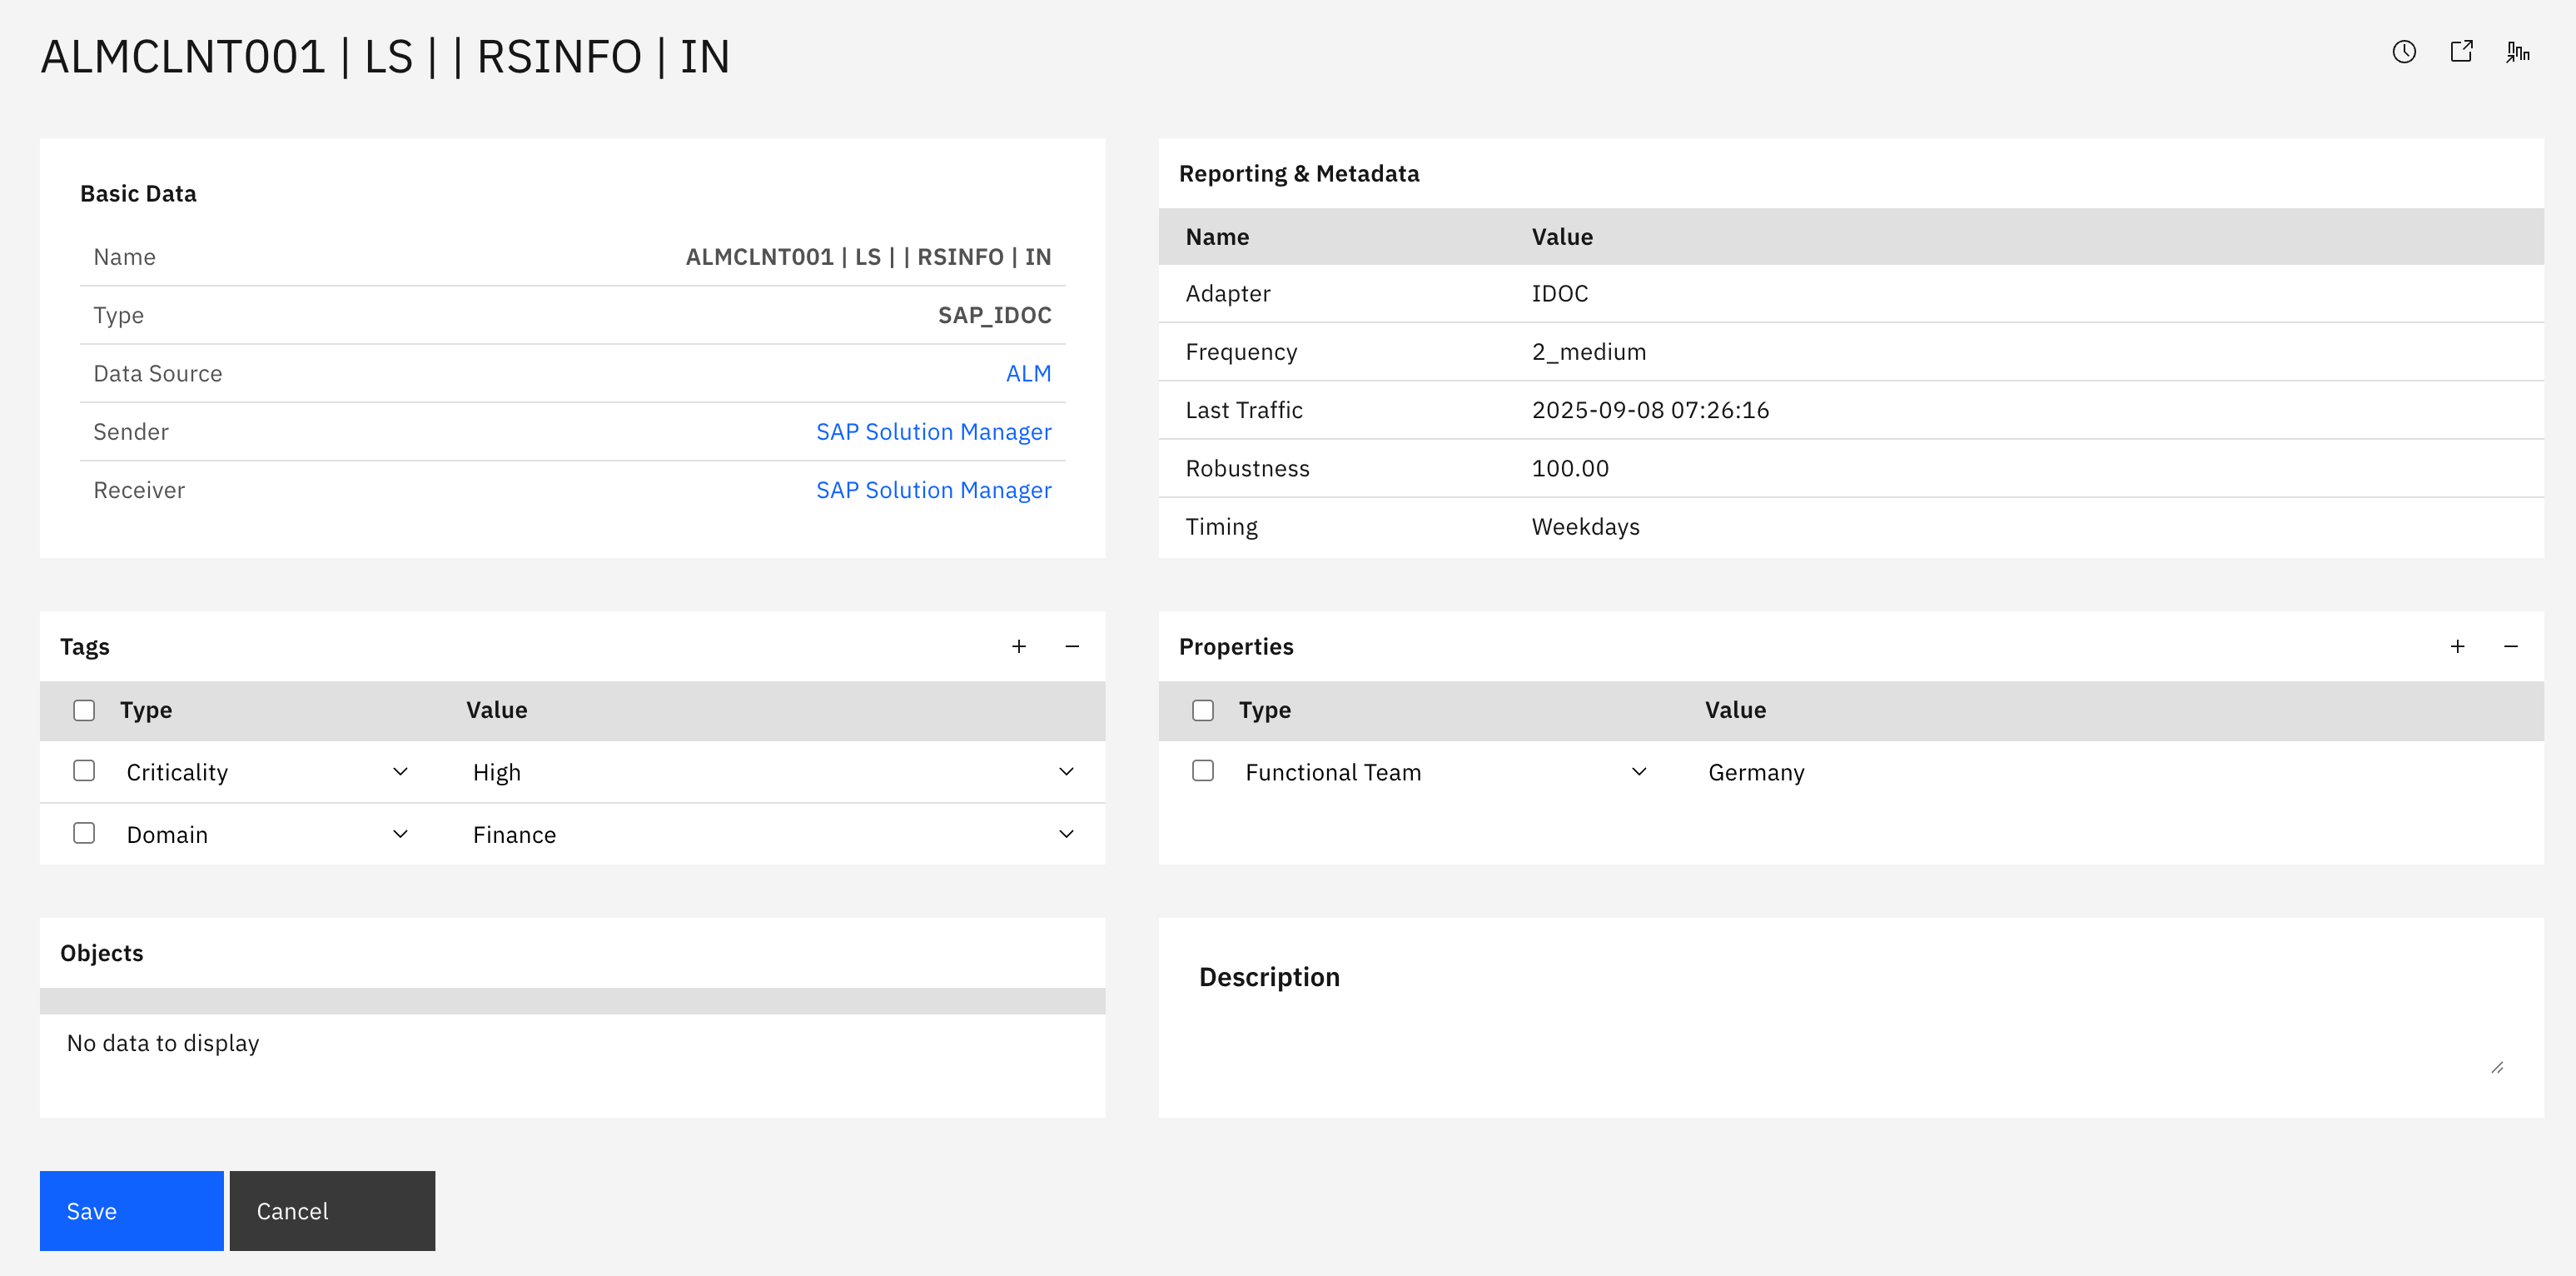
Basic Data section displays:
-
Name: Complete interface identifier
-
Type: Interface type (SAP_IDOC)
-
Data Source: Source system identifier
-
Sender: Message sender system
-
Receiver: Message receiver system
Reporting & Metadata section displays:
-
Adapter: Protocol adapter type (IDOC)
-
Frequency: Message frequency classification (2_medium)
-
Last Traffic: Timestamp of last message activity
-
Robustness: Processing reliability percentage (100.00)
-
Timing: Processing schedule pattern (Weekdays)
Tags section displays:
-
Type: Tag category (Criticality, Domain)
-
Value: Tag values (High, Finance)
Properties section displays:
-
Type: Property category (Functional Team)
-
Value: Property values (Germany)
Note: Clicking the interface name navigates to the complete interface configuration in the Inventory section for detailed technical specifications and management.
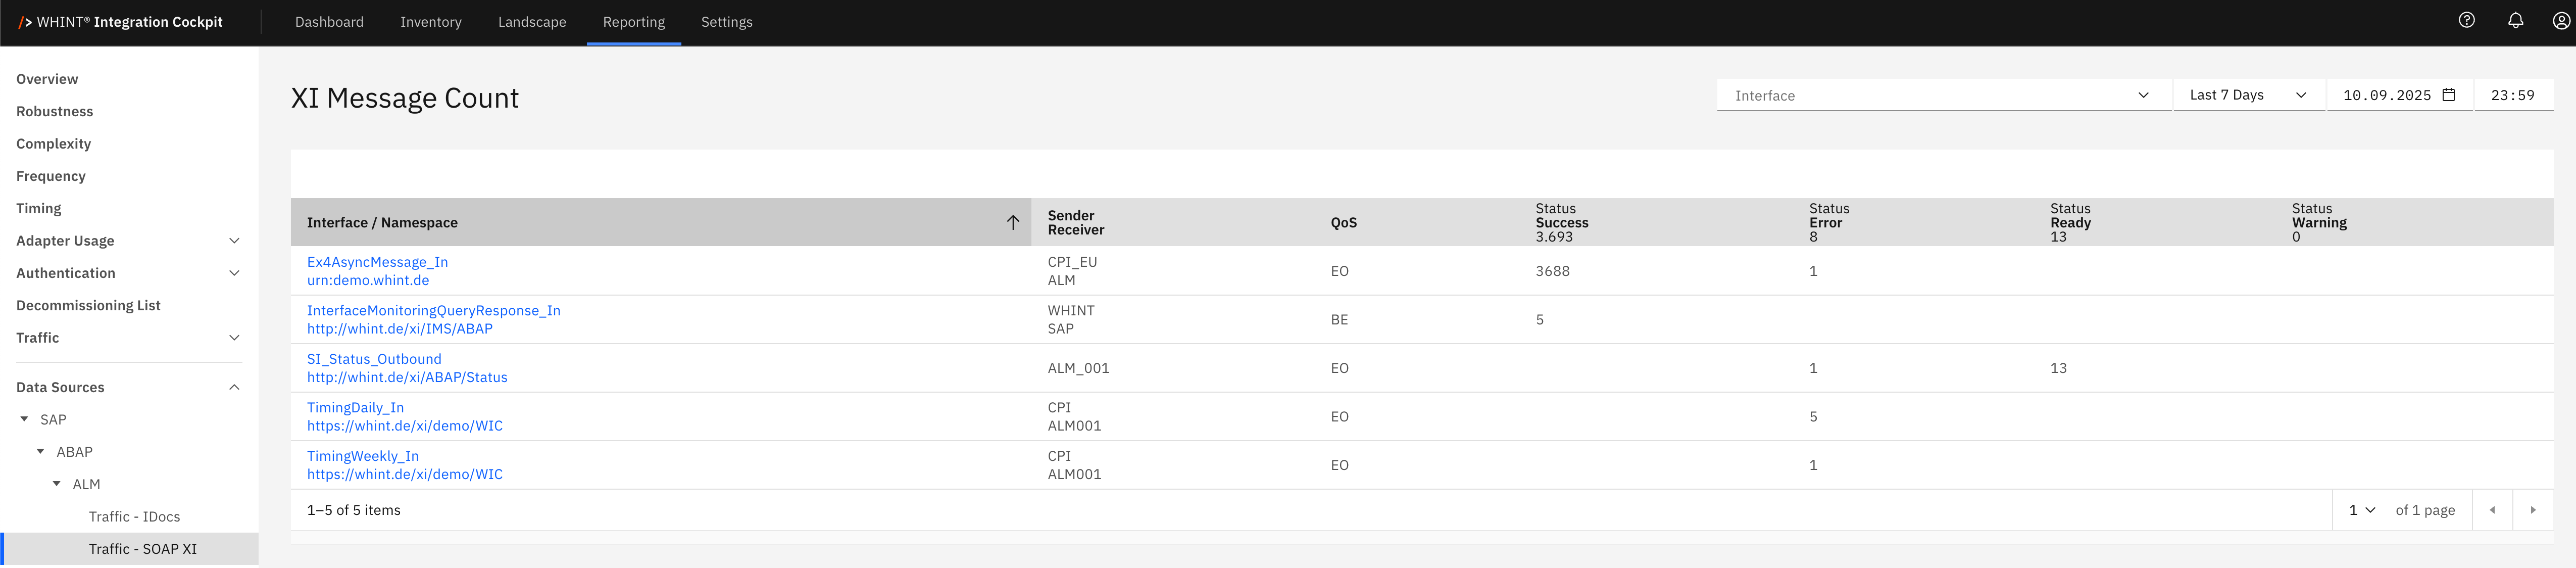
XI Message Count
The XI Message Count report displays traffic volume and processing status for XI (Exchange Infrastructure) messages flowing through the Process Integration engine. This view helps you monitor enterprise application integration performance, track message processing success rates and identify integration bottlenecks for reliable real-time business process automation.
What you see:
-
Interface / Namespace: XI interface identifier with technical namespace (clickable)
-
Sender / Receiver: Source and target system identifiers
-
QoS: Quality of Service level (EO - Exactly Once, BE - Best Effort)
-
Status Success: Number of successfully processed XI messages
-
Status Error: Number of failed XI message processing attempts
-
Status Ready: Number of XI messages waiting for processing
-
Status Warning: Number of XI messages with processing warnings
XI Interface Detail View
Clicking an interface name opens the interface configuration view in the Inventory section showing:
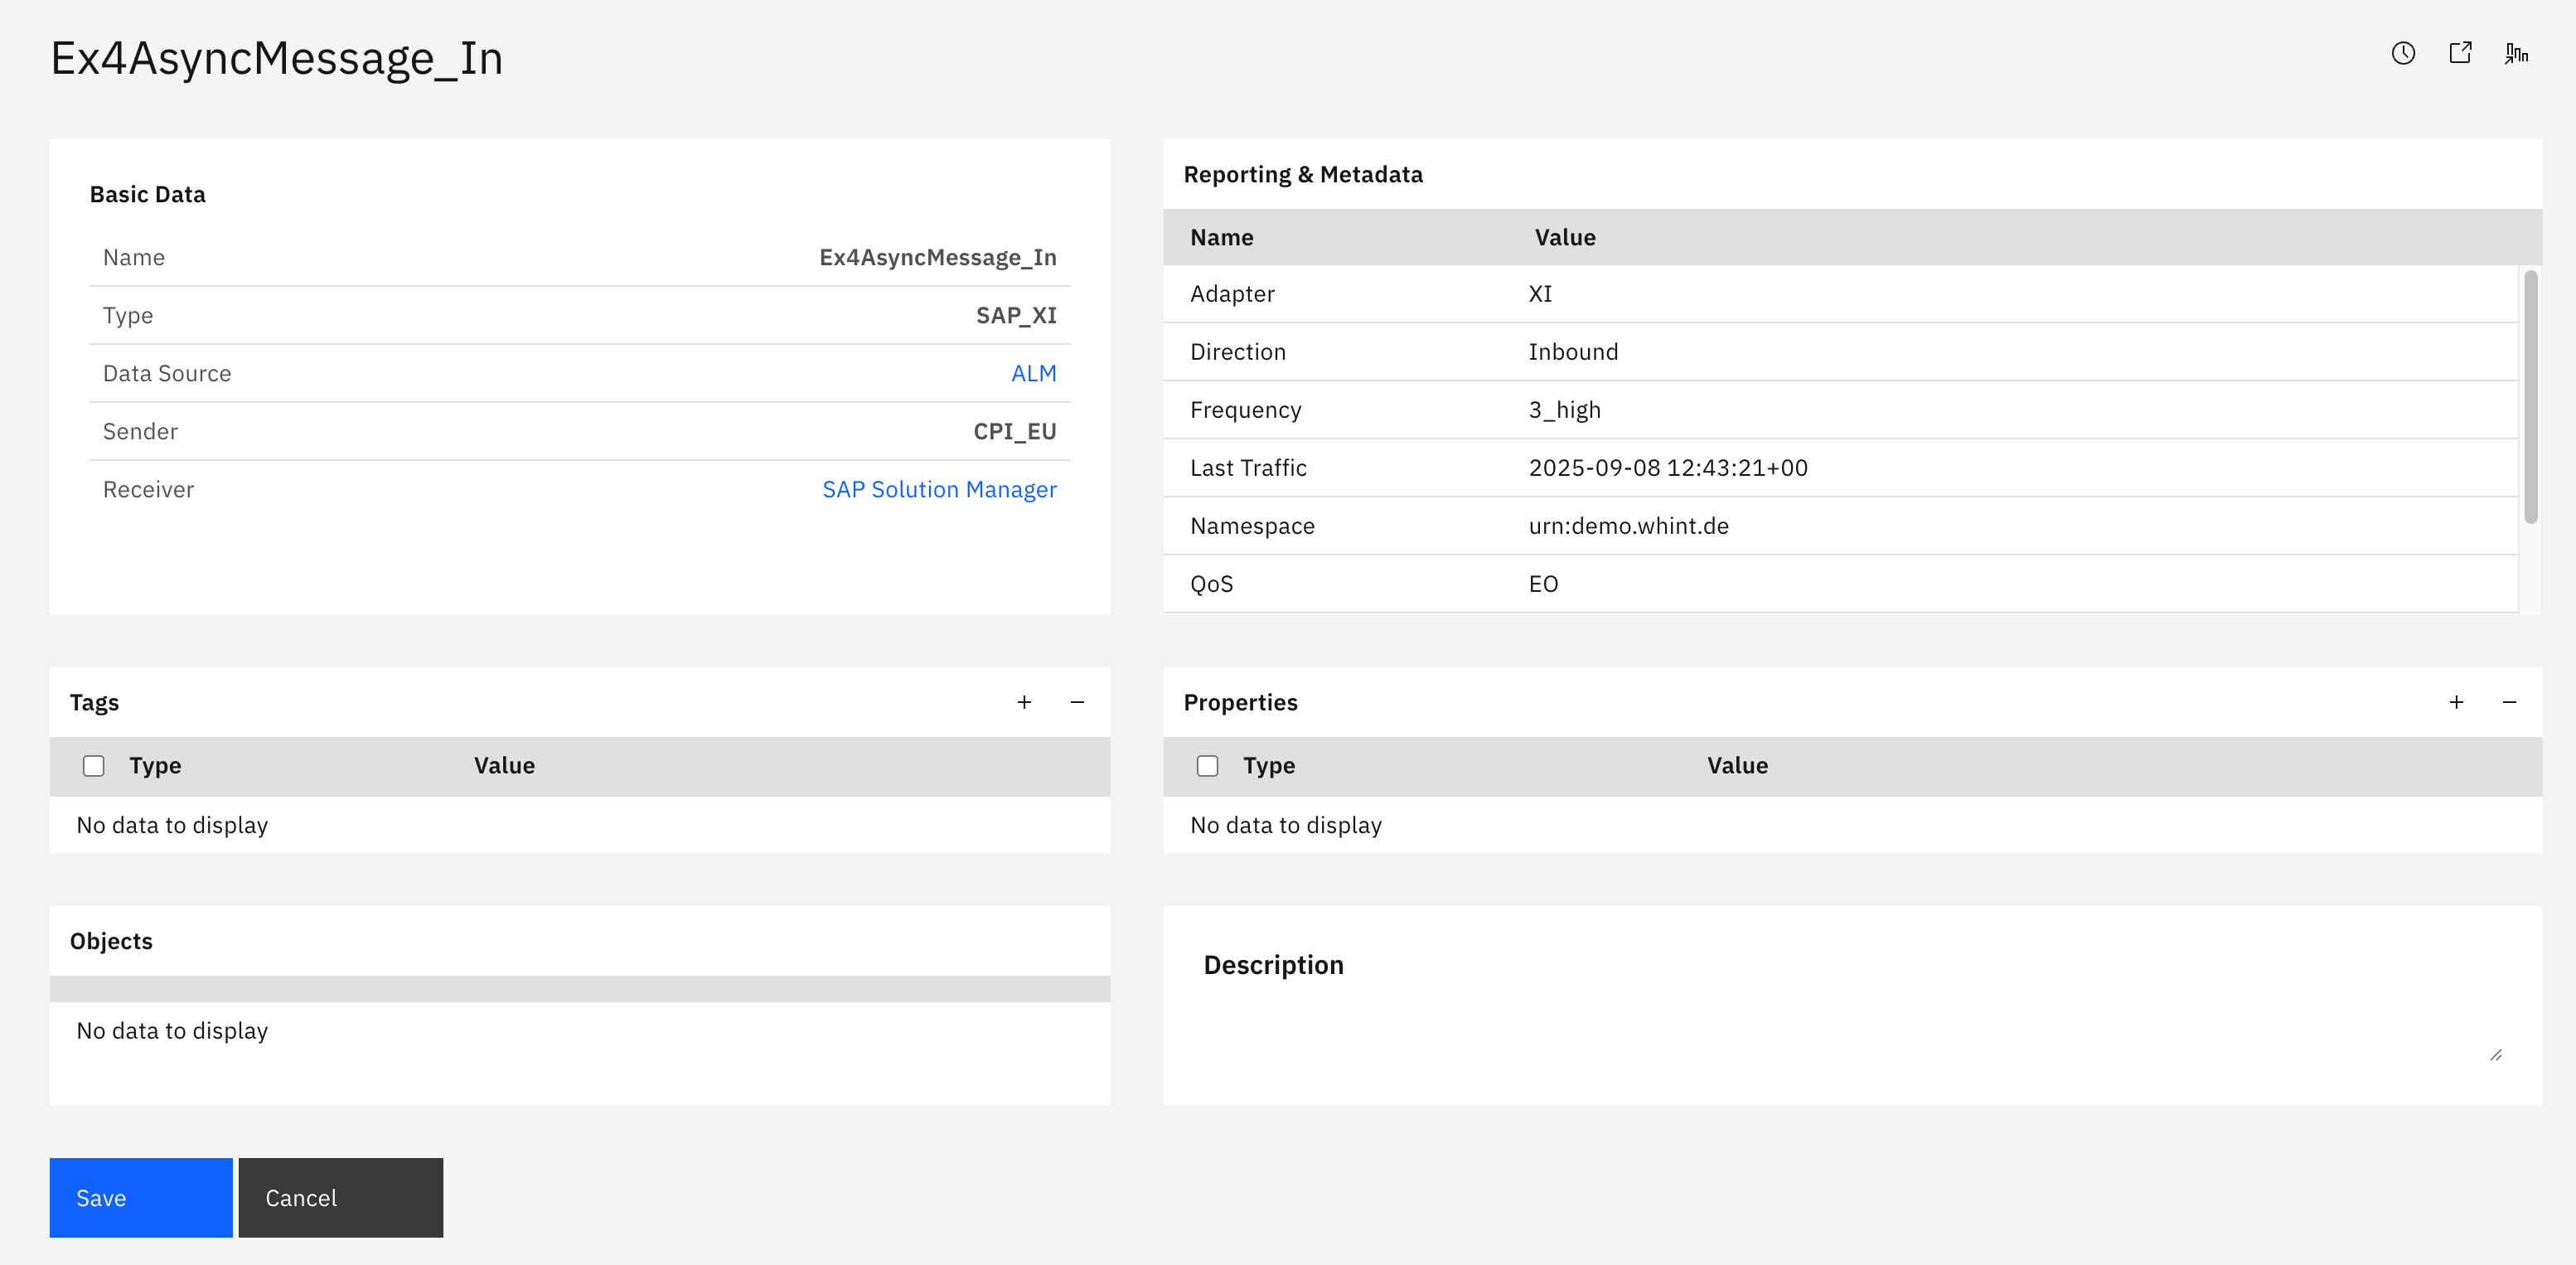
Basic Data section displays:
-
Name: Complete XI interface identifier
-
Type: Interface type (SAP_XI)
-
Data Source: Source system identifier
-
Sender: Message sender system (CPI_EU)
-
Receiver: Message receiver system (SAP Solution Manager)
Reporting & Metadata section displays:
-
Adapter: Protocol adapter type (XI)
-
Direction: Message flow direction (Inbound/Outbound)
-
Frequency: Message frequency classification (3_high)
-
Last Traffic: Timestamp of last message activity
-
Namespace: Technical namespace URI (urn:demo.whint.de)
-
QoS: Quality of Service level (EO - Exactly Once)
Tags section displays:
-
Type: Tag categories for interface classification
-
Value: Tag values for organizational metadata Note: Shows "No data to display" when no tags are configured
Properties section displays:
-
Type: Property categories for interface attributes
-
Value: Property values for technical specifications Note: Shows "No data to display" when no properties are configured
Note: Clicking the interface name navigates to the complete interface configuration in the Inventory section for detailed technical specifications and management.
Navigation
All reporting views include:
-
Time period selector (Last 7 Days dropdown) for traffic analysis
-
Interface filter dropdown for focused monitoring
-
Status columns providing real-time processing metrics
-
Clickable interface names that navigate to detailed inventory configurations
Last Updated: September 10, 2025