
The SAP BTP API Management section provides comprehensive analytics and performance monitoring for your API proxies, products and consuming applications.
This reporting helps organizations track API usage patterns, identify performance bottlenecks, monitor error rates, and ensure optimal API service delivery across enterprise integration landscapes..
Navigate to Reporting → SAP → BTP → API Management → [Data Source Name] → Traffic to access these analytics views.
Message Count & Performance
The Message Count & Performance view displays traffic analytics and operational metrics for API proxies across products and applications. This view helps you monitor API usage patterns, identify high-traffic APIs, track error rates, and analyze response times for performance optimization and capacity planning.
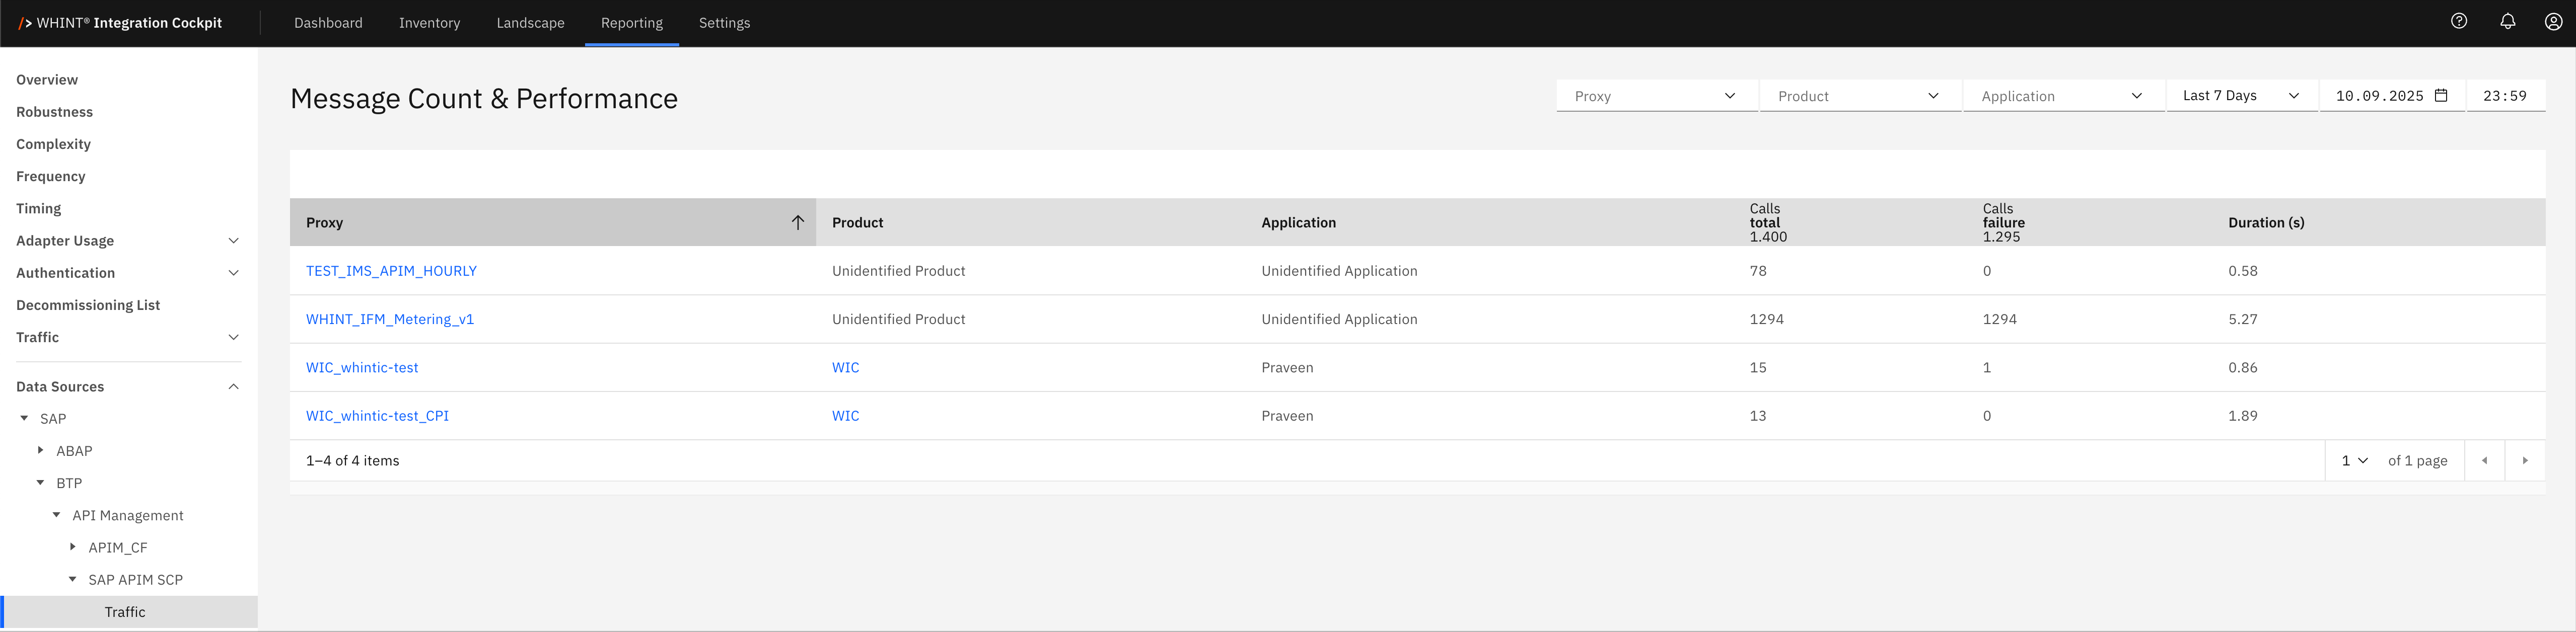
What you see:
-
Proxy: API proxy identifier that processes incoming requests (clickable)
-
Product: API product bundle containing the proxy
-
Application: Consuming application or client identifier
-
Calls total: Total number of API calls processed during the selected time period
-
Calls failure: Number of failed API calls indicating error conditions
-
Duration (s): Average response time in seconds for API call processing
Proxy Detail View
Clicking a proxy name opens a detailed view showing:
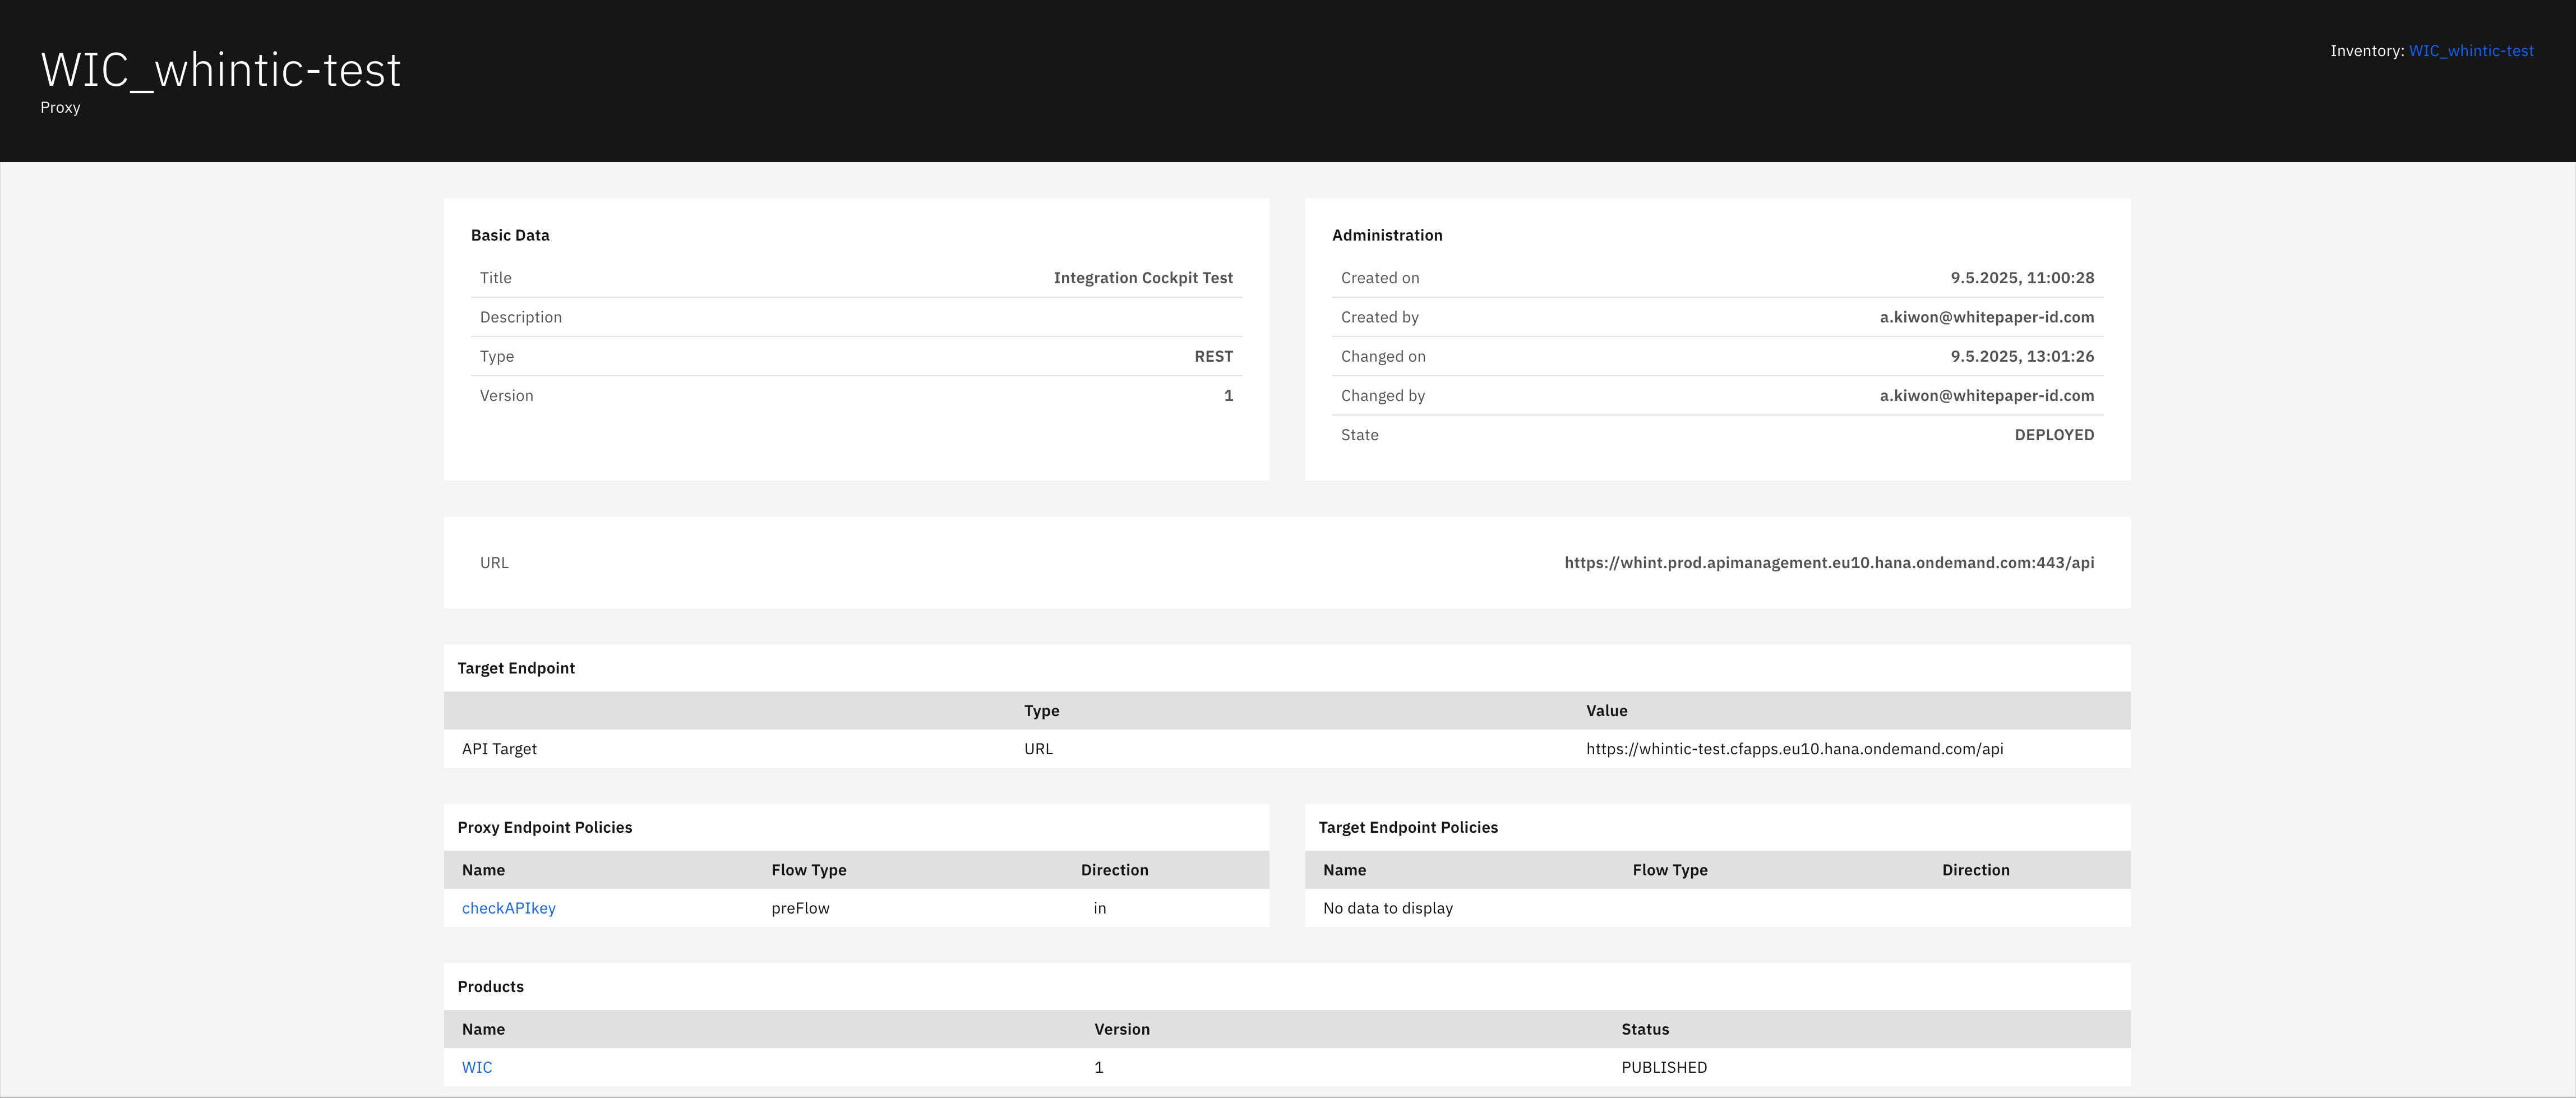
Basic Data section displays:
-
Title: Proxy display name and description
-
Description: Detailed proxy functionality description
-
Type: API proxy type (REST/SOAP)
-
Version: Current proxy version number
Administration section displays:
-
Created on: Proxy creation timestamp
-
Created by: User who created the proxy
-
Changed on: Last modification timestamp
-
Changed by: User who last modified the proxy
-
State: Current deployment status (DEPLOYED/UNDEPLOYED)
Target Endpoint section displays:
-
API Target: Backend service endpoint configuration
-
Type: Target endpoint type (URL)
-
Value: Full backend service URL for proxy routing
Proxy Endpoint Policies section displays:
-
Name: Policy identifier applied to incoming requests (clickable)
-
Flow Type: Policy execution stage (preFlow/postFlow/conditionalFlow)
-
Direction: Policy application direction (in/out)
Target Endpoint Policies section displays:
-
Name: Policy identifier applied to backend requests
-
Flow Type: Backend policy execution stage
-
Direction: Backend policy application direction
Note: Shows "No data to display" when no target policies are configured
Products section displays:
-
Name: API product containing this proxy (clickable)
-
Version: Product version number
-
Status: Product publication status (PUBLISHED/UNPUBLISHED)
Navigation
Analytics views include:
-
Time range filters (Last 7 Days, etc.) for historical analysis
-
Product and Application dropdowns for filtered reporting
-
Search and refresh capabilities for real-time monitoring
-
Drill-down navigation through blue-highlighted proxy and product names
Business Value: This analytics capability enables API administrators to monitor service health, identify performance issues, track usage trends, and ensure SLA compliance across API portfolios. The detailed proxy configuration visibility supports troubleshooting, policy management, and operational governance for enterprise API landscapes.
Last Updated: September 10, 2025