
The SAP BTP Cloud Integration section provides comprehensive traffic analytics and message monitoring for your integration flows and artifacts. This reporting helps organizations track integration performance, monitor message processing status, identify bottlenecks, and ensure optimal service delivery across enterprise integration landscapes with real-time visibility and historical analysis capabilities.
Navigate to Reporting → Data Sources → SAP → BTP → Cloud Integration → <Data Source Name> → Traffic to access these analytics views.
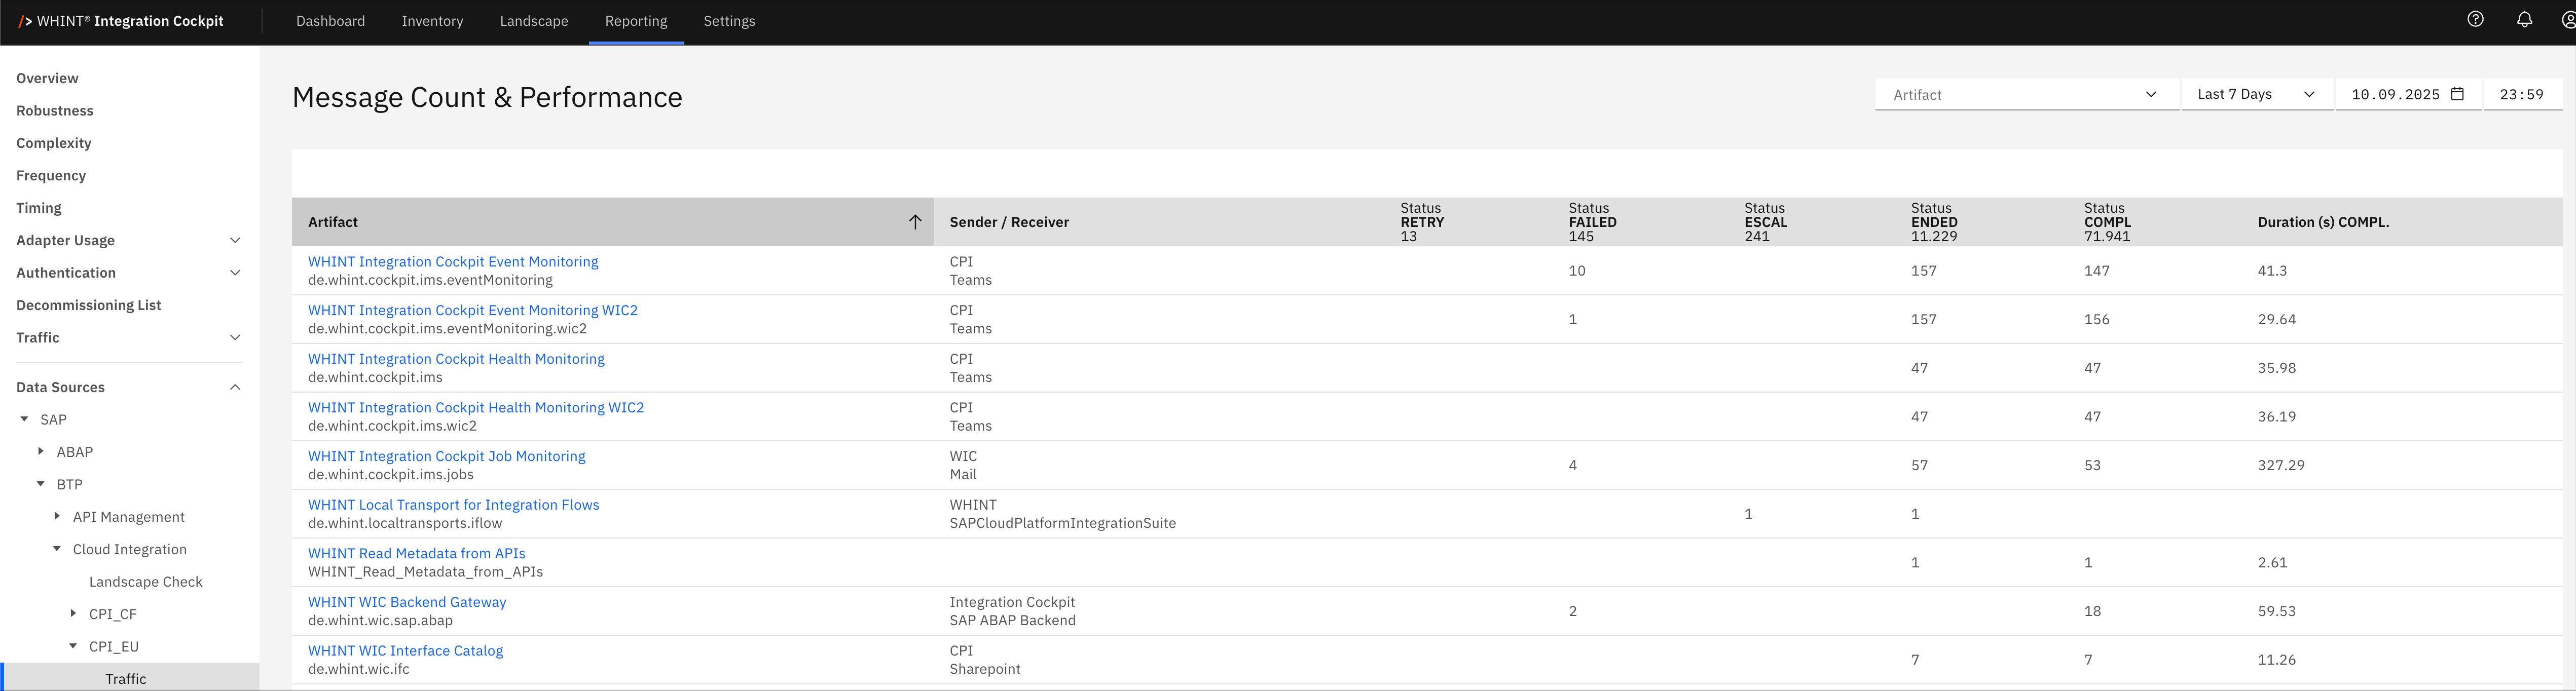
Message Count & Performance
The Message Count & Performance view displays traffic analytics and operational metrics for integration artifacts including message processing status, error tracking, and performance measurements. This view helps you monitor integration flow health, identify processing issues, track message volumes and analyze response times for SLA compliance and capacity planning.
What you see:
-
Artifact: Integration flow or artifact name that processes messages (clickable)
-
Sender / Receiver: Source and target systems participating in the integration
-
Status RETRY: Number of messages currently in retry status awaiting reprocessing
-
Status FAILED: Number of messages that failed processing and require attention
-
Status ESCAL: Number of messages escalated to error handling processes
-
Status ENDED: Number of messages that completed processing (successful or failed)
-
Status COMPL: Number of messages completed successfully
-
Duration (s) COMPL: Average processing time in seconds for completed messages
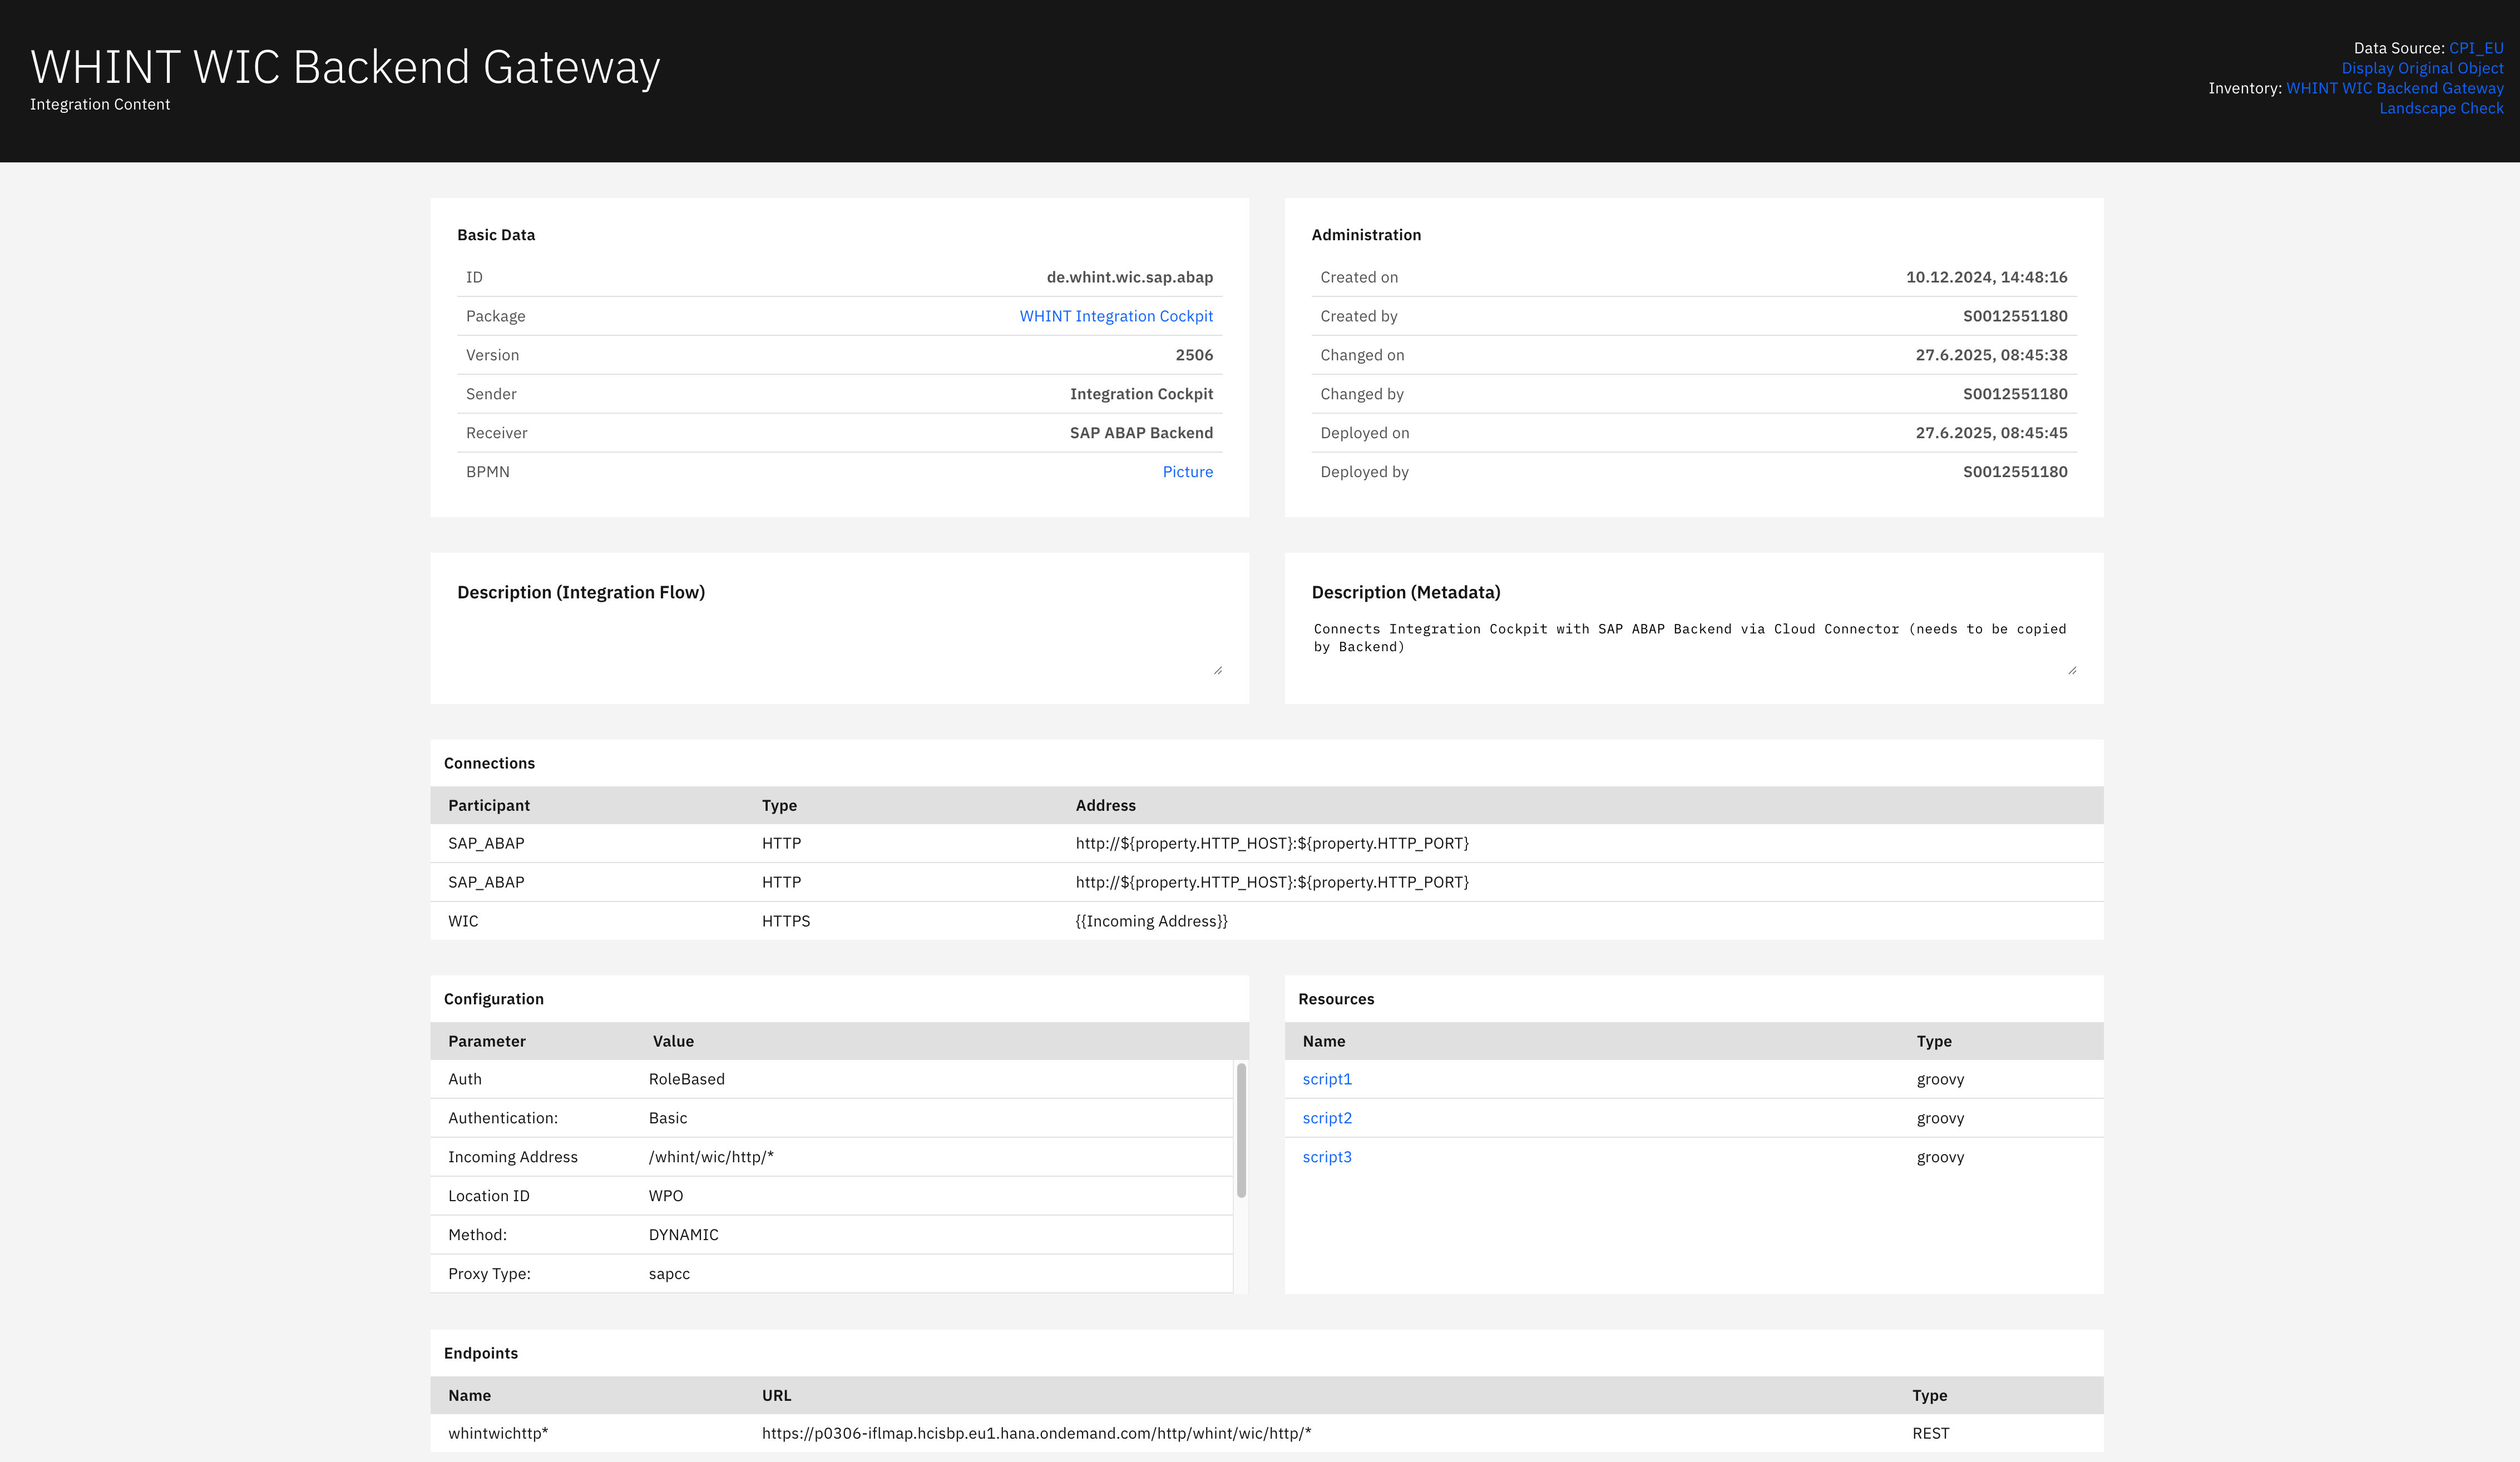
Integration Artifact Detail View
Clicking an artifact name opens a detailed view showing:
s
Basic Data section displays:
-
ID: Unique artifact identifier
-
Package: Integration package containing the artifact (clickable)
-
Version: Current artifact version number
-
Sender: Source system initiating the integration
-
Receiver: Target system receiving the integration data
-
BPMN: Business Process Model link for workflow visualization
Administration section displays:
-
Created on: Artifact creation timestamp
-
Created by: User identifier who created the artifact
-
Changed on: Last modification timestamp
-
Changed by: User identifier who last modified the artifact
-
Deployed on: Deployment timestamp
-
Deployed by: User identifier who deployed the artifact
Description (Integration Flow) section displays:
-
Integration flow description and functional purpose
Description (Metadata) section displays:
-
Technical metadata description including connectivity requirements and data flow details
Connections section displays:
-
Participant: System or service participant identifier
-
Type: Connection protocol (HTTP/HTTPS/SOAP)
-
Address: Connection endpoint URL or address configuration
Configuration section displays:
-
Parameter: Configuration parameter name
-
Value: Parameter value setting (Auth, Authentication, Incoming Address, Location ID, Method, Proxy Type)
Resources section displays:
-
Name: Resource file identifier (scripts, configurations) (clickable)
-
Type: Resource file type (groovy/script)
Endpoints section displays:
-
Name: Endpoint identifier
-
URL: Full endpoint URL for service access
-
Type: Endpoint type (REST/SOAP)
Navigation
Analytics views include:
-
Time range filters (Last 7 Days, etc.) for historical message analysis
-
Artifact dropdowns for focused integration flow reporting
-
Search and refresh capabilities for real-time monitoring updates
-
Drill-down navigation through blue-highlighted artifact and package names
-
Status filtering to focus on specific message processing states
Last Updated: September 10, 2025