
The Logs interface provides real-time access to Integration Cockpit system logs for monitoring platform operations, troubleshooting issues, and tracking system activity across data source processing, user sessions and background tasks.
Purpose: Monitor system operations, track user activity, troubleshoot platform issues, and audit system events through comprehensive logging with configurable filtering and debug-level visibility controls.
Navigate to Settings → Operations → Logs to access the system logs interface.
Logs Overview
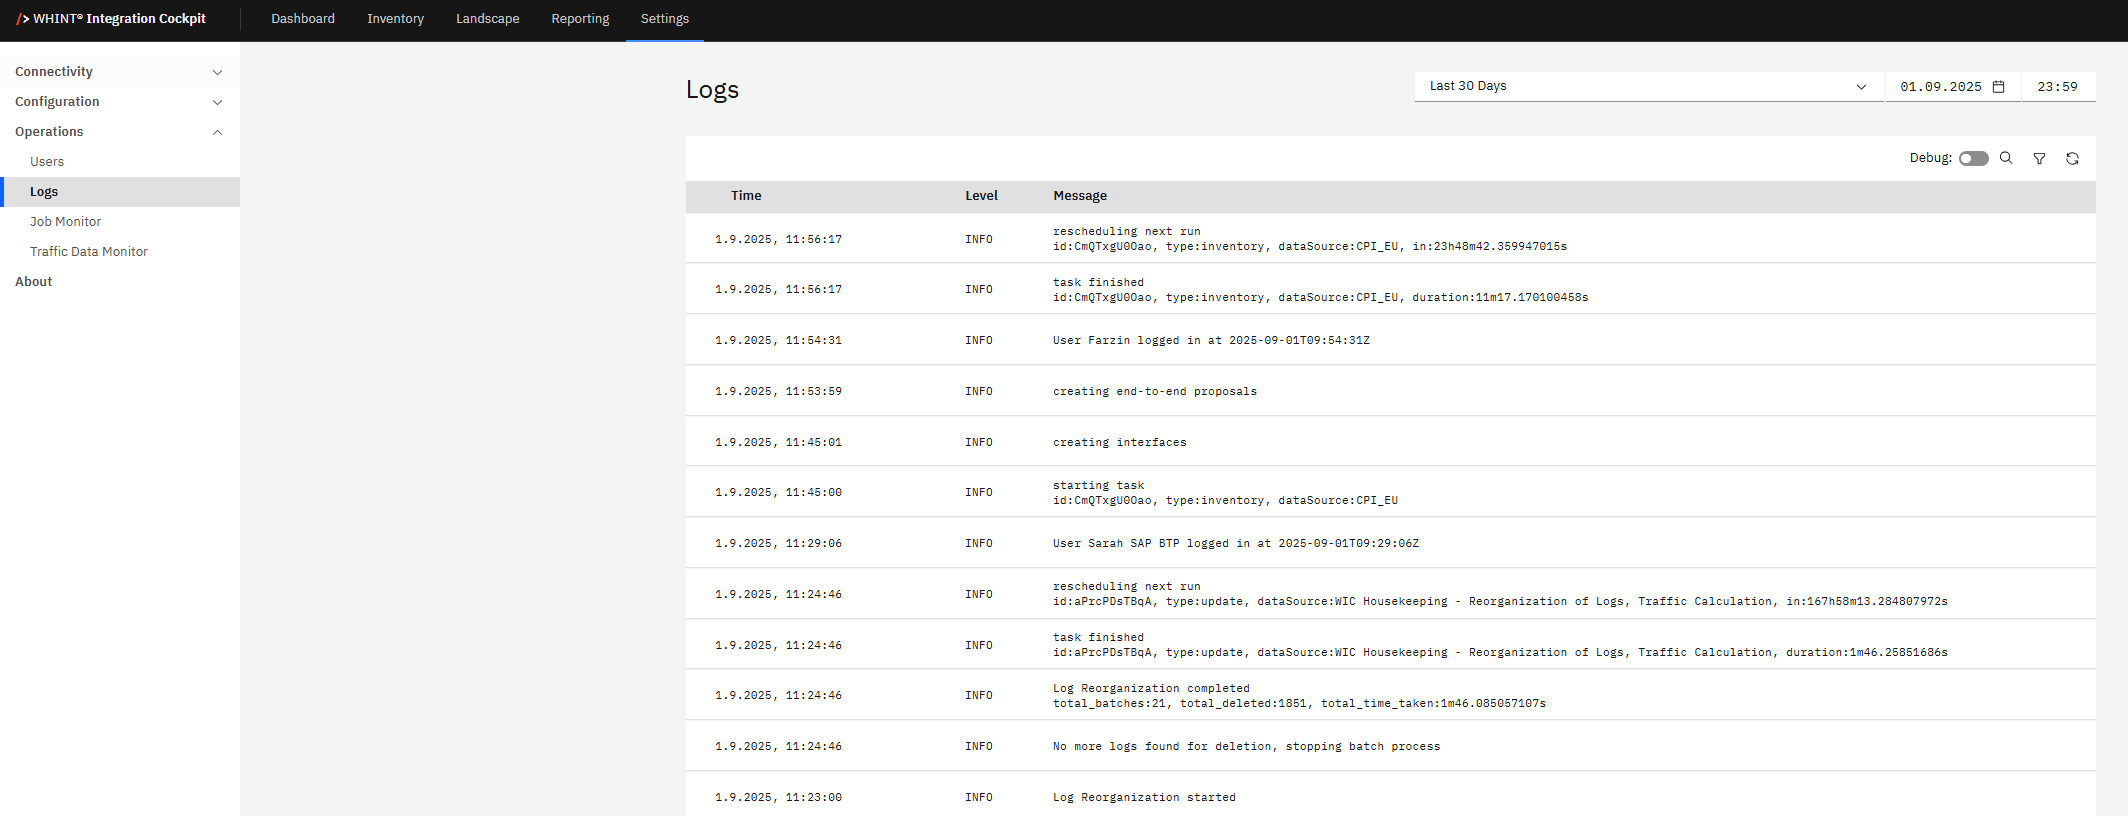
What you see:
-
Log entries table with chronological system activity (newest first)
-
Time column showing precise timestamps for all system events
-
Level column indicating log severity (INFO, DEBUG, ERROR, WARN)
-
Message column containing detailed system operation descriptions
-
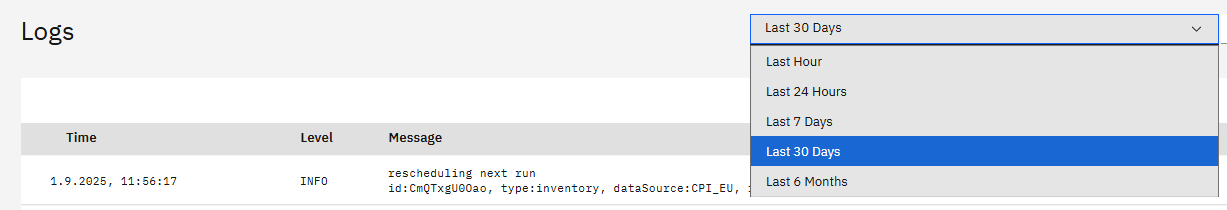
Time range filter (Last 30 Days dropdown) for historical log access
-
Debug toggle to show/hide detailed debug-level logging information
Log Monitoring Features
Filtering and Navigation:
-
Time Range Selection - Filter logs by specific periods: Last Hour, Last 24 Hours, Last 7 Days, Last 30 Days or Last 6 Months
-
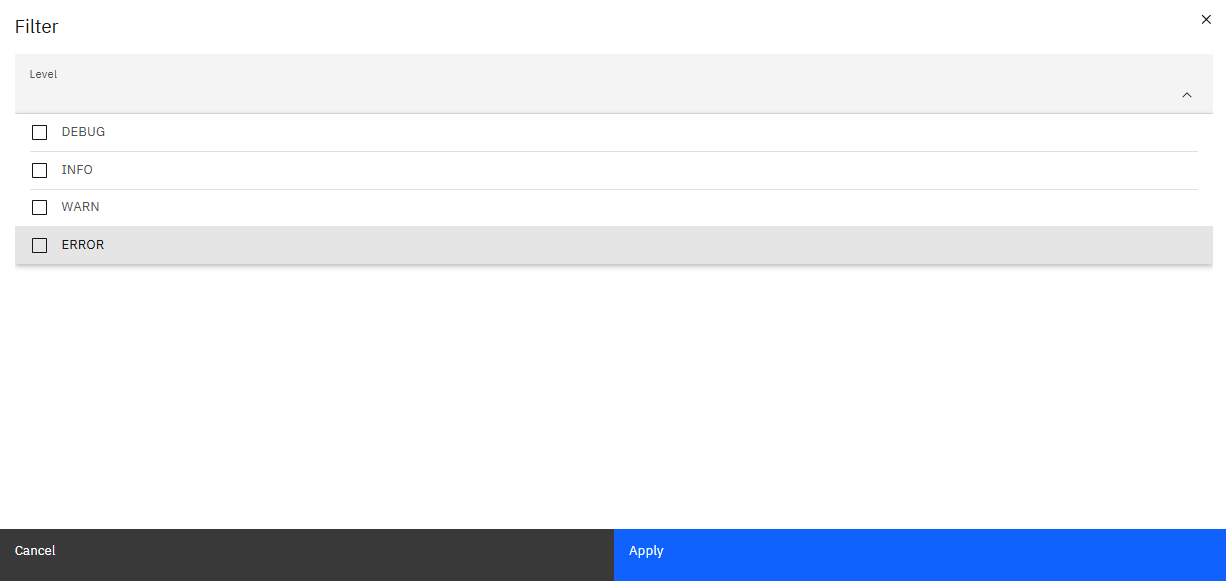
Log Level Filtering - Use filter dialog to show/hide specific log levels: DEBUG, INFO, WARN and ERROR
-
Debug Mode Toggle - Enable to view detailed debug information for in-depth troubleshooting
-
Real-time Updates - Log entries appear automatically as system events occur
-
Auto-refresh - Interface updates continuously to show latest system activity
Log Types and Information:
-
System Operations - Data source processing, inventory updates, job scheduling
-
User Activity - Login sessions, configuration changes, user actions
-
Background Tasks - Automated processes, data synchronization, maintenance operations
-
Error Events - System errors, connectivity issues, processing failures
-
Performance Metrics - Task completion times, processing durations, system performance data
Usage and Troubleshooting
Operational Monitoring
-
Track system health through regular monitoring of INFO-level messages
-
Identify processing patterns via scheduled task and inventory update logs
-
Monitor user activity through login and session management entries
-
Review performance using task completion and duration information
Troubleshooting Support
-
Enable Debug mode for detailed diagnostic information during issue investigation
-
Filter by time range to focus on periods when issues occurred
-
Monitor error patterns to identify recurring system problems
-
Track user actions for audit and access control verification
Use time range filtering to focus on relevant periods during troubleshooting. Enable Debug mode only when needed for detailed diagnostics to avoid information overload. Monitor logs regularly for error patterns and system performance indicators.
Log Management
The logs interface provides read-only access to system events for monitoring and troubleshooting purposes. Log retention and storage are managed automatically by the platform. For critical system events, consider establishing external log monitoring or alerting systems based on your operational requirements.
Last Updated: September 01, 2025