
The Traffic Data Monitor provides comprehensive visibility into message traffic volume across all configured data sources, enabling analysis of communication patterns, data flow volumes, and processing activity across your integration landscape.
Purpose: Monitor message traffic volumes, analyze communication patterns across data sources, track processing activity over time, and identify high-volume interfaces requiring performance attention or capacity planning.
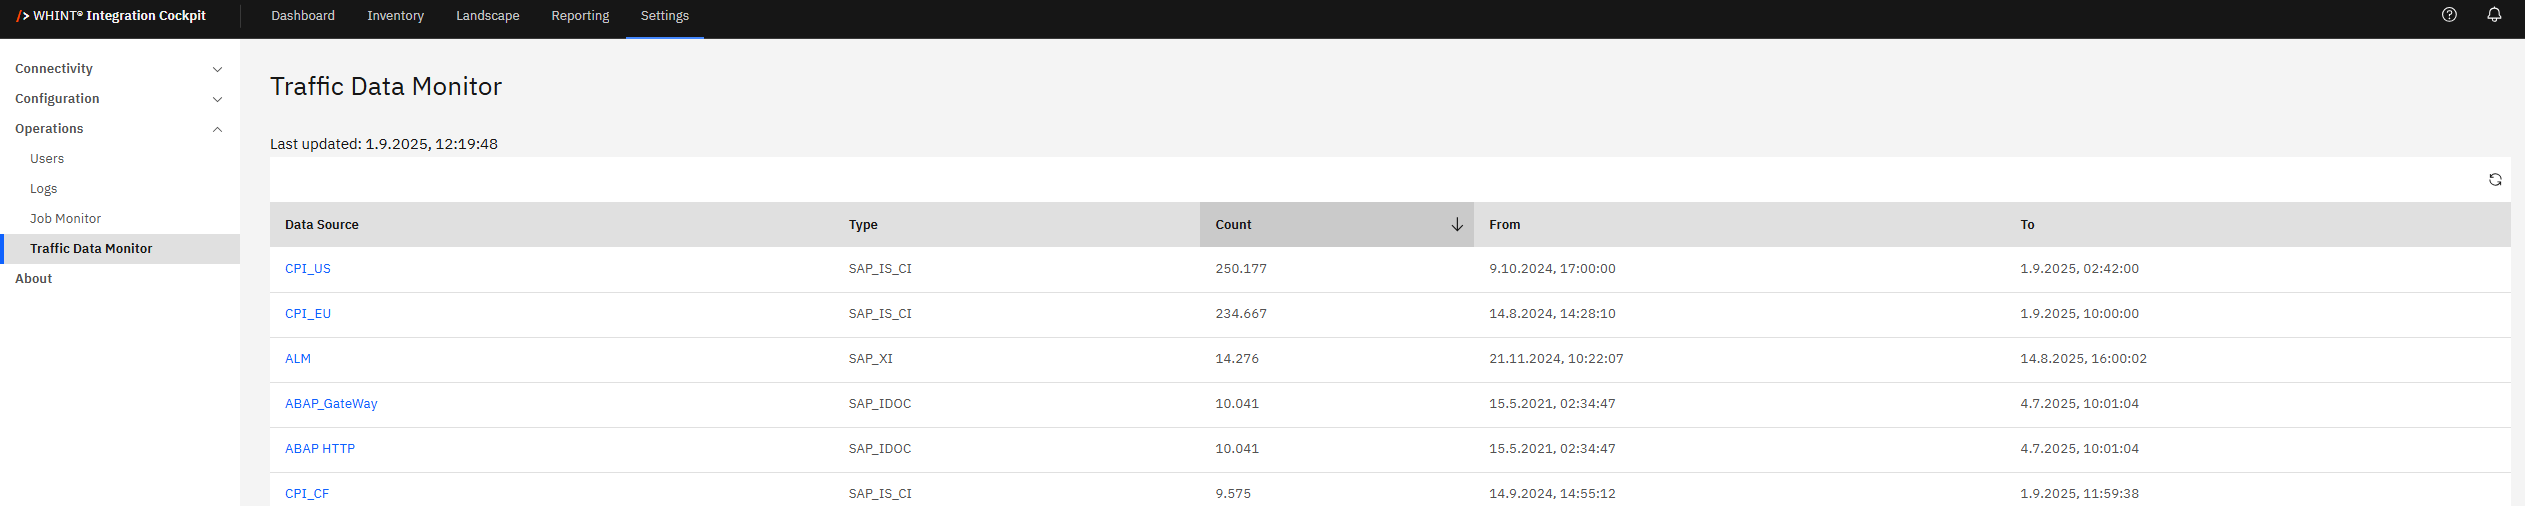
Navigate to Settings → Operations → Traffic Data Monitor to access the traffic monitoring interface.
Traffic Monitor Overview
What you see:
-
Data source listings showing all configured integration platforms and their traffic activity
-
Integration types (SAP_IS_CI, SAP_IDOC, SAP_XI, SAP_IS_APIM) indicating platform technologies
-
Message counts displaying total processed messages for each data source
-
Time periods showing "From" and "To" timestamps for traffic collection windows
-
Last updated timestamp indicating when traffic data was refreshed
-
Sortable columns for organizing data by count, data source name, type or time periods
Traffic Analysis Features
Data Organization
-
Sort by volume - Click Count column to identify highest-traffic data sources
-
Sort by data source - Organize alphabetically by clicking Data Source column
-
Sort by type - Group by integration platform type for technology analysis
-
Sort by timeframe - Order by From/To timestamps for chronological analysis
Navigation and Analysis
-
Data source links - Click blue highlighted data source names to access configuration details
-
Volume analysis - Compare message counts to identify high-volume interfaces
-
Time period tracking - Monitor data collection windows and processing schedules
-
Pagination controls - Navigate through multiple pages of traffic data
Traffic Monitoring Usage
Performance Analysis
-
Identify high-volume sources requiring performance optimization or capacity planning
-
Compare traffic patterns across different integration platforms and technologies
-
Track processing activity over specific time windows for trend analysis
-
Monitor data collection effectiveness through message count verification
Operational Insights
-
Capacity planning based on message volume trends and peak processing periods
-
Platform utilization analysis across SAP_IS_CI, SAP_IDOC, and other integration types
-
Data source health verification through consistent traffic collection patterns
-
Processing window optimization based on traffic volume and timing patterns
Regularly monitor high-volume data sources for performance optimization opportunities. Use sorting capabilities to quickly identify traffic patterns and outliers. Click through to data source configurations when traffic volumes indicate potential performance or capacity issues.
Integration with System Monitoring
Traffic data directly supports capacity planning, performance optimization and integration landscape governance. The monitor provides operational visibility that complements Dashboard Traffic KPIs and supports data-driven decisions about infrastructure scaling and performance tuning.
Last Updated: September 01, 2025