

The Job Monitor shows the scheduled tasks of every data source, when each of them last ran, whether it succeeded and how long it took.
Purpose: Monitor task execution, identify failed or outdated runs, and check whether data collection and processing are running as expected.
Navigate to Settings → Operations → Job Monitor.
For creating tasks and choosing a schedule, see Step 1: Create Data Sources & Schedule Tasks in the Onboarding Guide, in particular the expandable Schedule Tasks (Run & Monitor Tasks).
Job Monitor Overview
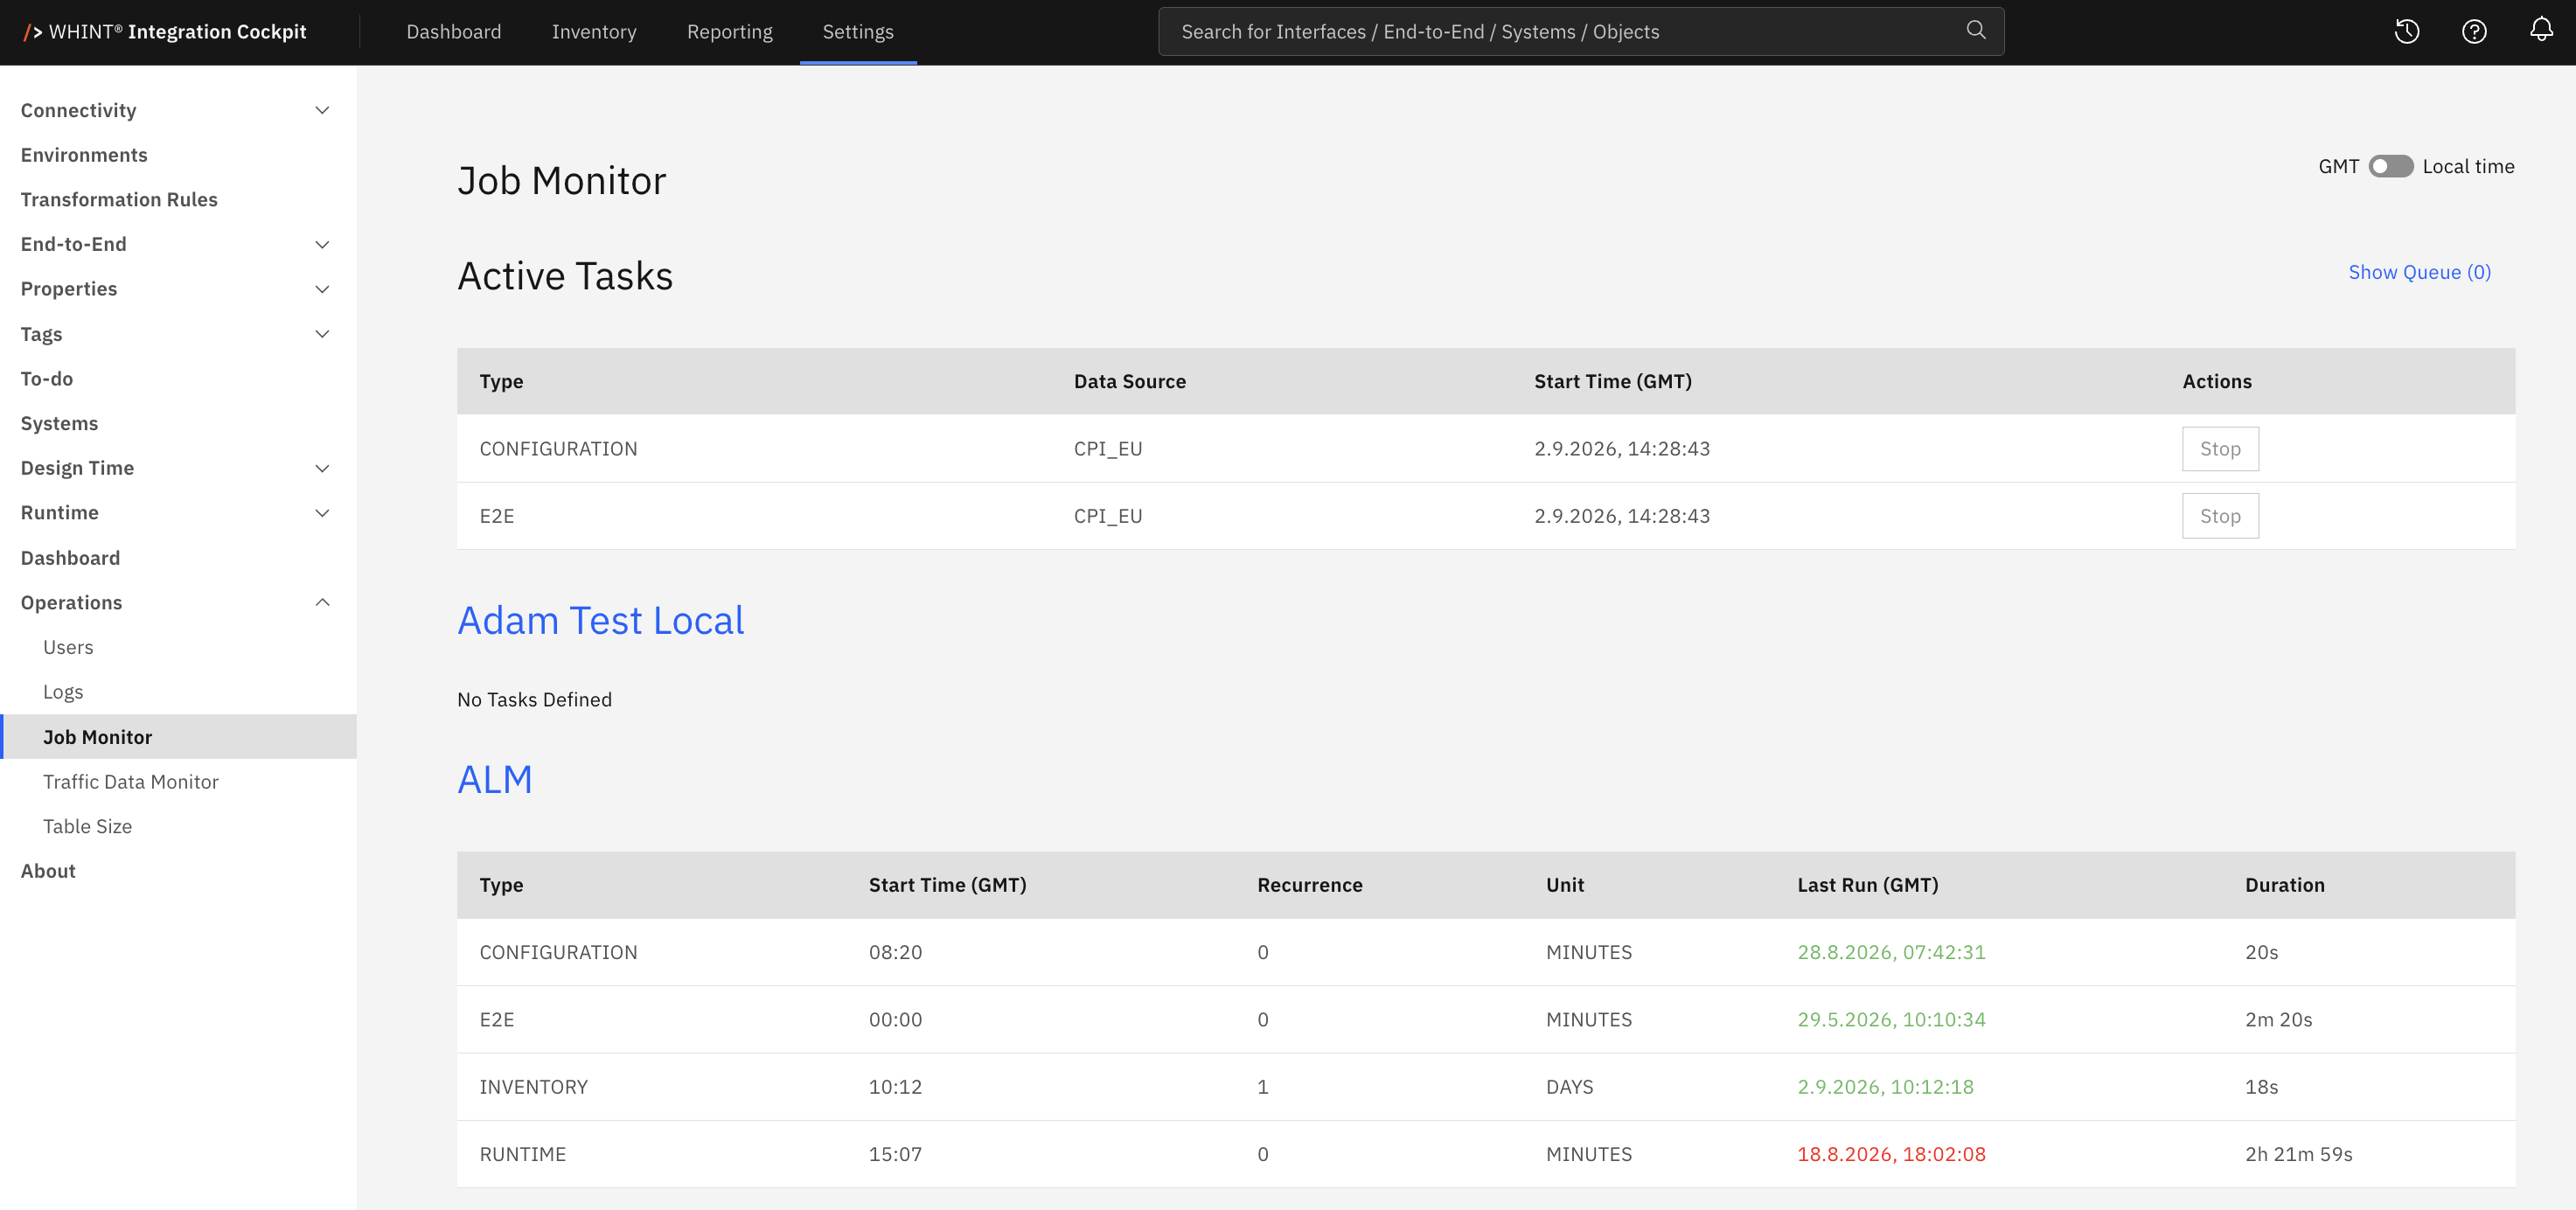
What you see:
-
GMT / Local time – switches all displayed times between GMT and your local time
-
Active Tasks – shows currently running tasks, including the queue and stop action
-
Data source sections – one section per configured data source
-
Task tables – show the schedule, last run and duration for each task
-
No Tasks Defined – shown for data sources without configured tasks
Time Zone
All times are shown in GMT by default. The column headers then read Start Time (GMT) and Last Run (GMT). Switch the toggle to Local time to convert them to your own time zone. The headers change accordingly.
Task schedules are stored in GMT, so the Start Time of a schedule is the GMT time configured on the data source.
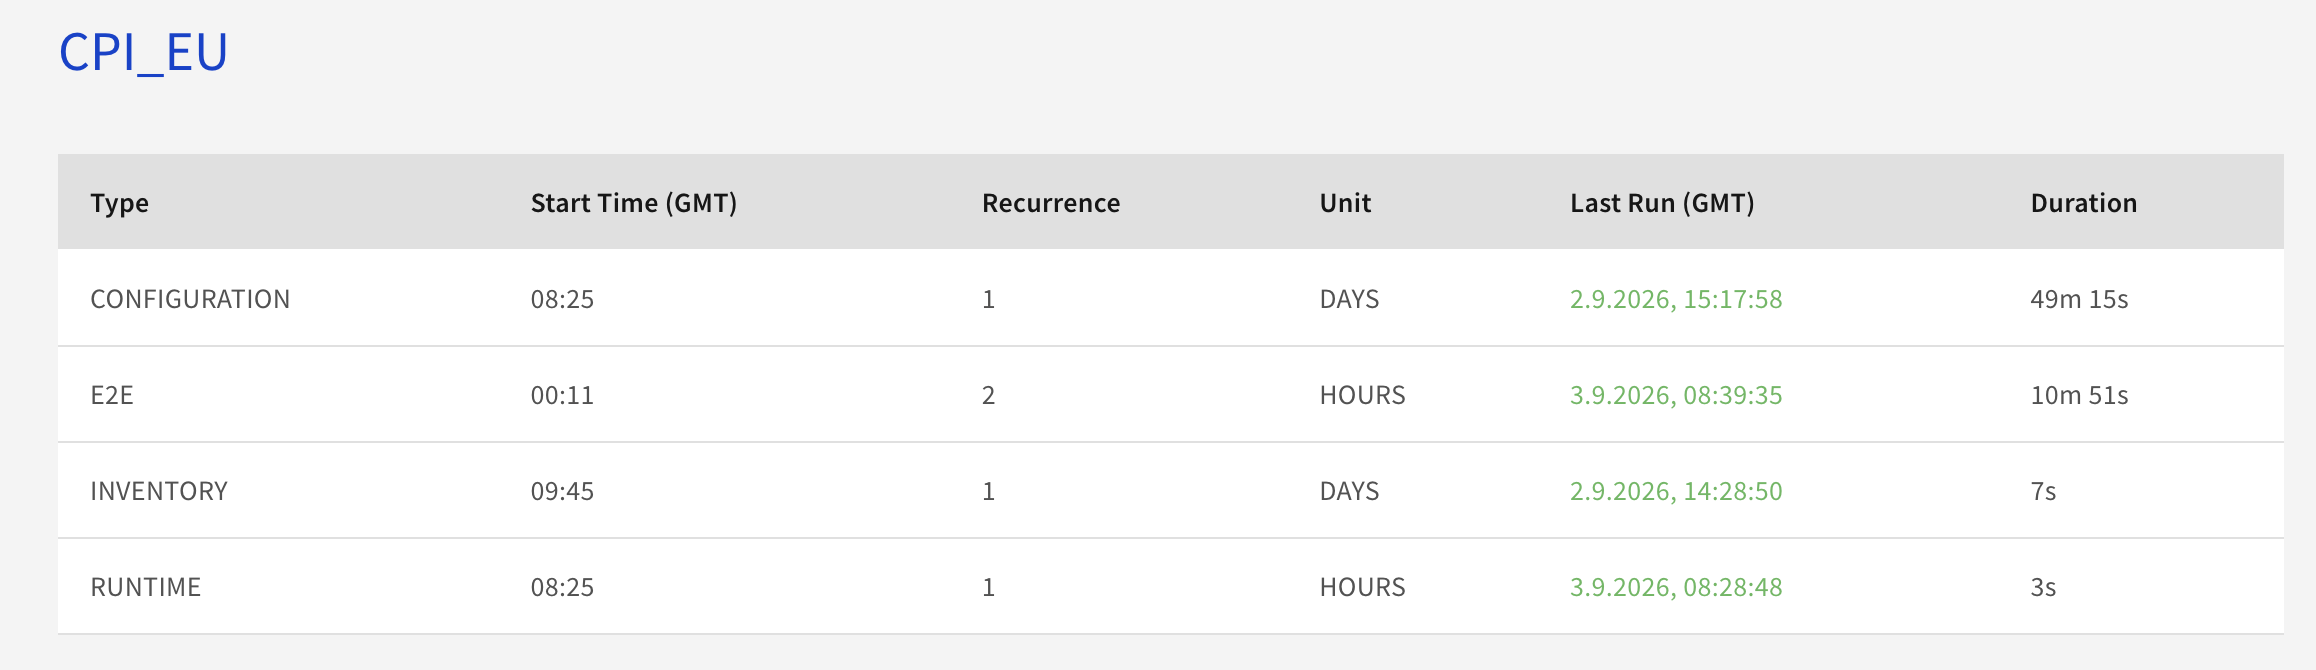
Task Schedules per Data Source
|
Column |
Content |
|---|---|
|
Type |
The task type |
|
Start Time |
The time of day the schedule starts |
|
Recurrence |
How often the task repeats, in the unit next to it |
|
Unit |
|
|
Last Run |
When the most recent run finished.
|
|
Duration |
How long that most recent run took |
Clicking the data source name opens its configuration, where tasks are maintained and can be started manually.
Active Tasks
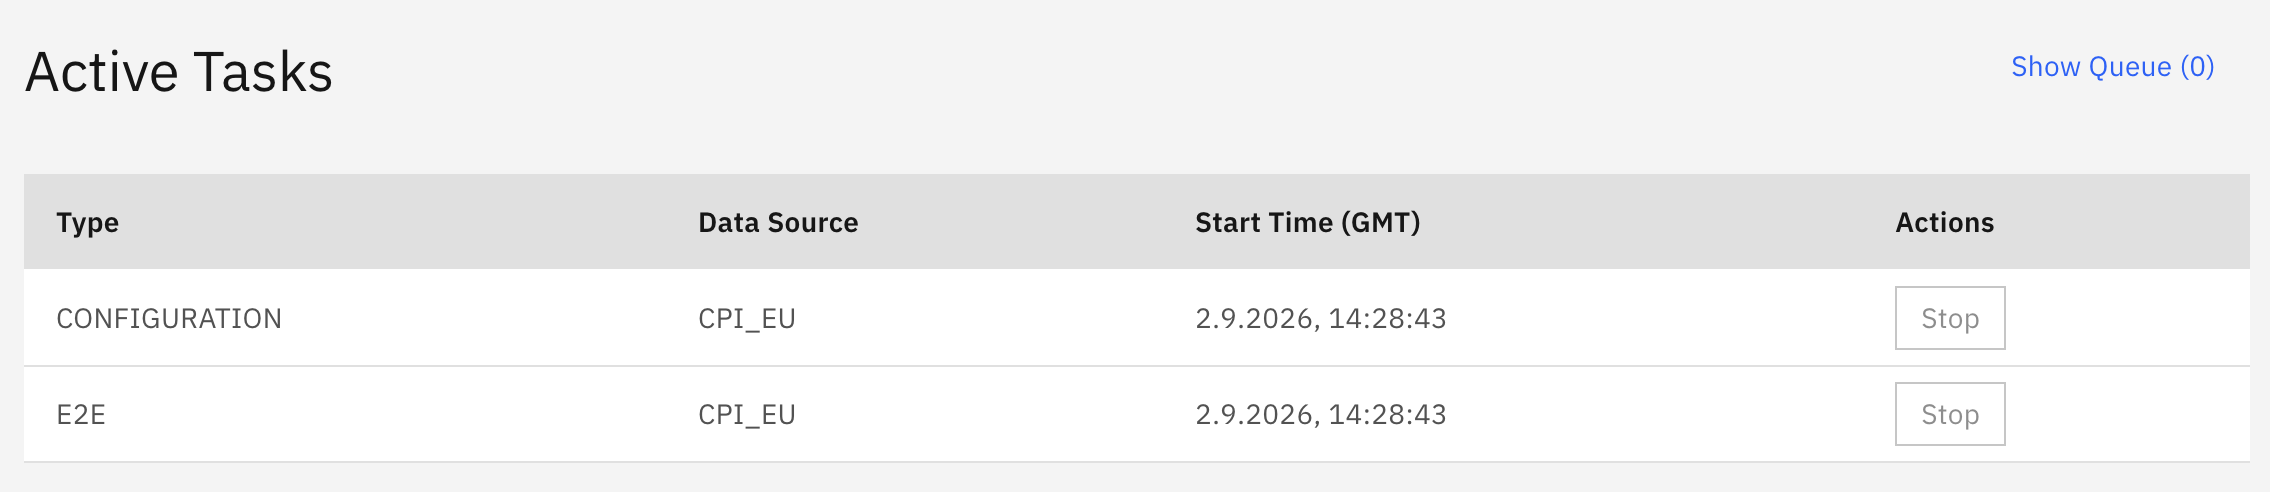
The Active Tasks section appears while tasks are running. It shows:
-
Type – the running task
-
Data Source – the data source being processed
-
Start Time – when the task started
-
Actions – the Stop button for the running task
Show Queue
At most four tasks run at the same time. Everything beyond that waits in a queue and starts as soon as a slot becomes free, in the order the runs were requested.
Show Queue next to the heading opens the Queued Tasks dialog with the waiting tasks and their data source, the number in the button is the current queue length.
A task that is already running or already waiting is not queued a second time. Starting it again manually reports success, but it is folded into the run that is already pending.
Stopping a Task
The Stop button becomes available only after a task has been running for more than 16 hours.
Until then it is disabled and shows the note Task can be stopped if it takes more than 16 hours. Stopping asks for confirmation and the button then shows Stopping….
A long-running task is not necessarily stuck. Check its Logs before stopping it, especially for the first Configuration run on a large tenant.
For SAP Integration Suite data sources (Cloud Integration and API Management), enable Delta Mode to process only changes after the first full run to significantly reduce runtime.
Task Types
|
Type |
What it does |
|---|---|
|
|
Reads the raw data from the connected system |
|
|
Turns the raw data into interface records and calculates the reporting KPIs |
|
|
Reads the message traffic |
|
|
Sends data to connected tools, for example an EAM system or Confluence |
|
|
Generates End-to-End flows |
Not every data source supports every task type, and the same type can do different work depending on the platform — the UPDATE task of the Housekeeping data source reorganizes the logs instead of sending data anywhere.
When a Task Fails
A red Last Run means the run ended with an error. The reason is in the log:
-
Note the data source and the task type.
-
Open Settings → Operations → Logs and set the time range around the Last Run timestamp.
-
Filter for
ERROR, or search for the data source name.
Use the task timestamp to correlate the Job Monitor entry with the corresponding log messages.
A task whose type is not supported by its data source fails on every run with the message service not found for task. Remove the task from the data source instead of retrying it.
After a platform downtime, tasks do not run all missed intervals.
The schedule resumes at the next valid time.
Related Documentation
-
Logs – The messages behind a failed run
-
Data Sources – Maintaining tasks and starting them manually
-
Step 1: Create Data Sources & Schedule Tasks – Recommended schedules and the gap between Configuration and Inventory
Last Updated: September 3, 2026