
The Anomalies monitoring system detects unusual traffic patterns and message volume deviations across your integration interfaces, helping identify potential issues, processing disruptions or unexpected system behavior through automated traffic analysis.
Purpose: Monitor interface message traffic for unusual patterns, detect volume anomalies that may indicate system issues and provide early warning for interfaces experiencing unexpected traffic deviations from established baselines.
Navigate to Reporting → Traffic → Anomalies to access the anomaly monitoring interface.
Anomalies Overview
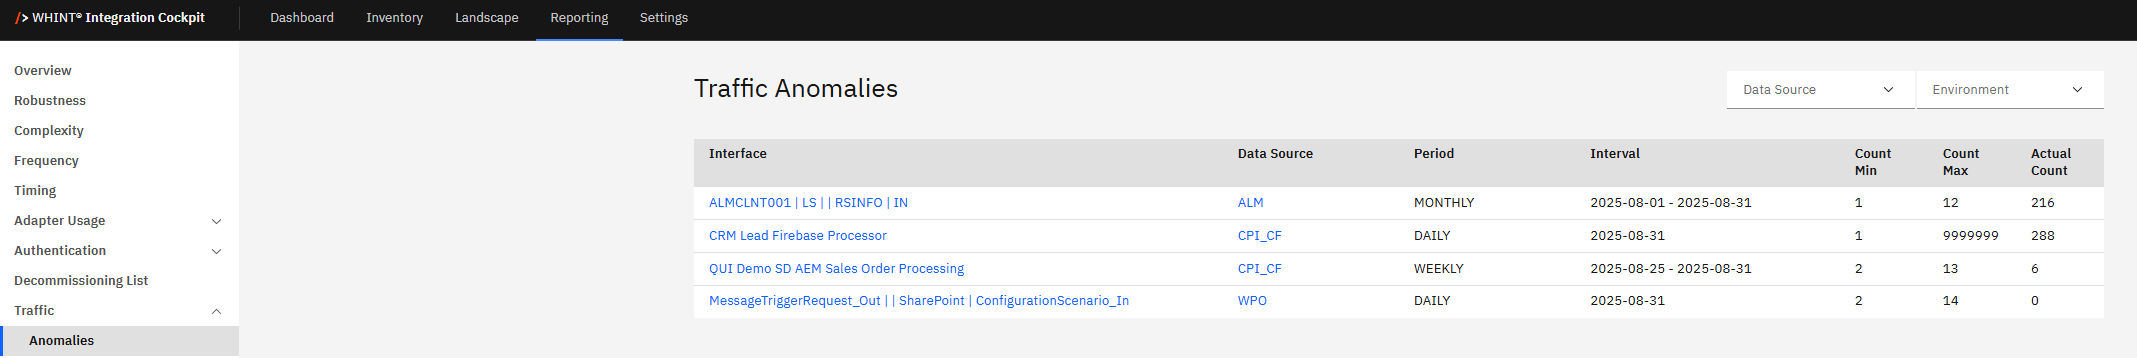
What you see:
-
Interface listings showing monitored interfaces across your integration landscape
-
Data source filtering to focus on specific integration platforms
-
Environment filtering to analyze anomalies by landscape tier (e.g. DEV, TEST, PROD)
-
Traffic baselines with Count Min and Count Max establishing expected volume ranges
-
Actual counts showing current message volumes compared to baseline expectations
-
Period and interval information indicating monitoring frequency (DAILY, WEEKLY, MONTHLY)
Anomaly Detection Features
Traffic Analysis
-
Baseline establishment - System learns normal traffic patterns and establishes expected volume ranges
-
Deviation detection - Identifies when actual message counts fall outside established Min/Max boundaries
-
Period-based monitoring - Analyzes traffic patterns across different time intervals (daily, weekly, monthly)
-
Multi-platform coverage - Monitors anomalies across various integration technologies and data sources
Filtering and Investigation
-
Data Source filtering - Focus anomaly analysis on specific integration platforms
-
Environment segmentation - Analyze traffic anomalies by landscape environment
-
Volume comparison - Compare actual traffic against established baseline ranges
-
Interface-specific tracking - Monitor individual interface patterns and deviations
Anomaly Configuration
Anomaly monitoring can be configured through the Dashboard configuration in Settings → Configuration → Dashboard → Anomalies.
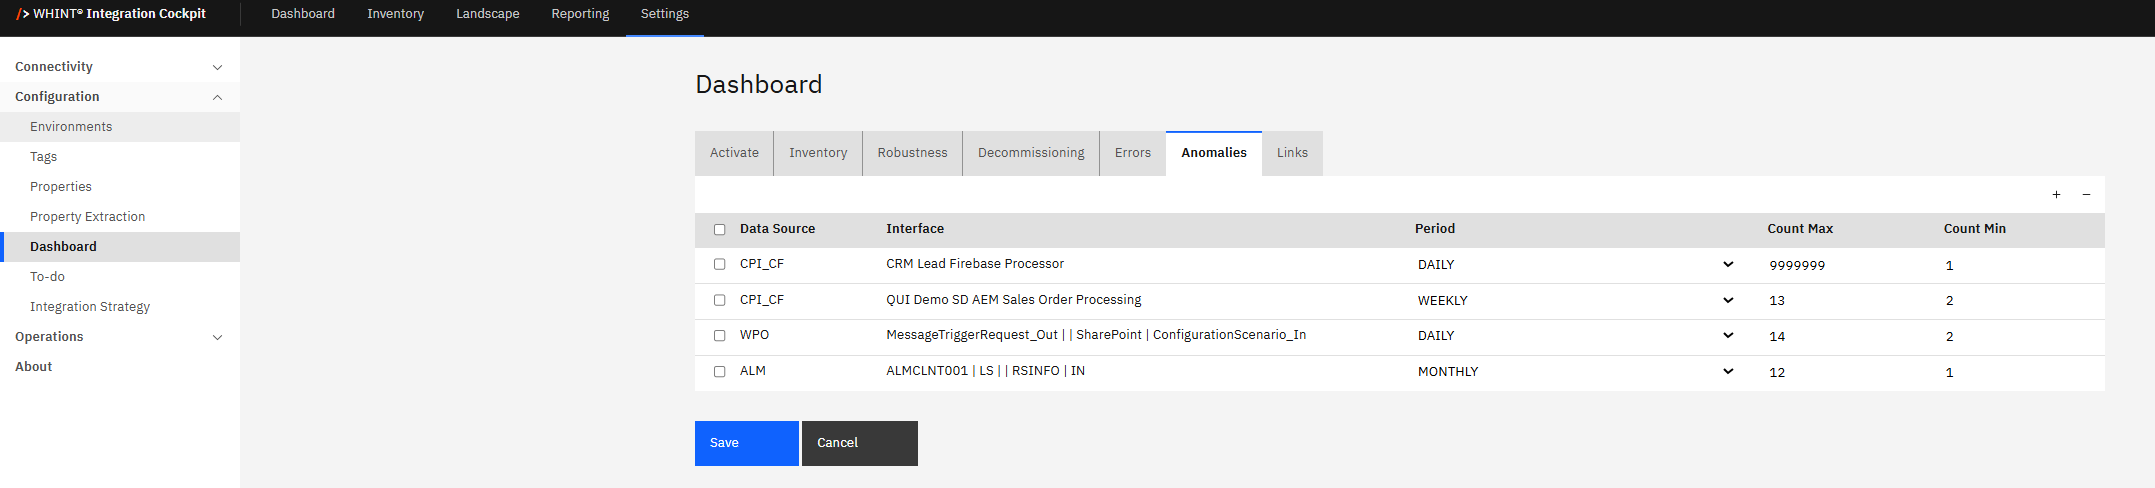
Configuration Options
-
Enable/disable monitoring - Select which interfaces to include in anomaly detection
-
Baseline parameters - Configure Count Min and Count Max thresholds for specific interfaces
-
Monitoring periods - Set appropriate monitoring intervals based on interface usage patterns
-
Alert thresholds - Define when deviations constitute actionable anomalies
Usage and Troubleshooting
Anomaly Investigation
-
Traffic pattern analysis - Use Min/Max ranges to understand normal interface behavior
-
Deviation identification - Focus on interfaces where Actual Count falls outside expected ranges
-
Trend monitoring - Track anomalies over time to identify recurring issues or patterns
-
Root cause analysis - Investigate underlying causes for significant traffic deviations
Operational Response
-
Performance impact assessment - Evaluate whether anomalies indicate system performance issues
-
Capacity planning - Use anomaly data to identify interfaces requiring scaling or optimization
-
Issue prioritization - Focus troubleshooting efforts on interfaces showing significant deviations
-
Preventive maintenance - Address anomalies before they impact system reliability
Regularly review anomaly reports to establish familiarity with normal traffic patterns. Investigate significant deviations promptly, especially those showing consistent patterns over time. Use environment filtering to focus on production anomalies that require immediate attention. Configure monitoring for business-critical interfaces first.
Integration with System Monitoring
Anomaly detection complements other Integration Cockpit monitoring capabilities by providing proactive identification of unusual patterns that might not be captured by standard error monitoring or performance metrics. This system supports early warning for potential issues and helps maintain system reliability.
Related Monitoring
-
Traffic Data Monitor - Analyze overall traffic volumes and processing patterns
-
Dashboard Traffic KPIs - View aggregated traffic trends and volume metrics
Last Updated: September 01, 2025