
Cost Allocation enables you to allocate integration platform costs to business units, regions or departments based on actual message traffic. By grouping interfaces using configurable tags (e.g. Country, Domain, Business Unit), you gain visibility into which parts of your organization drive integration usage - supporting transparent cost distribution, capacity planning and architecture optimization decisions.
Navigate to Reporting → Cost Allocation to access traffic distribution analytics with pie chart visualization and filtering capabilities.
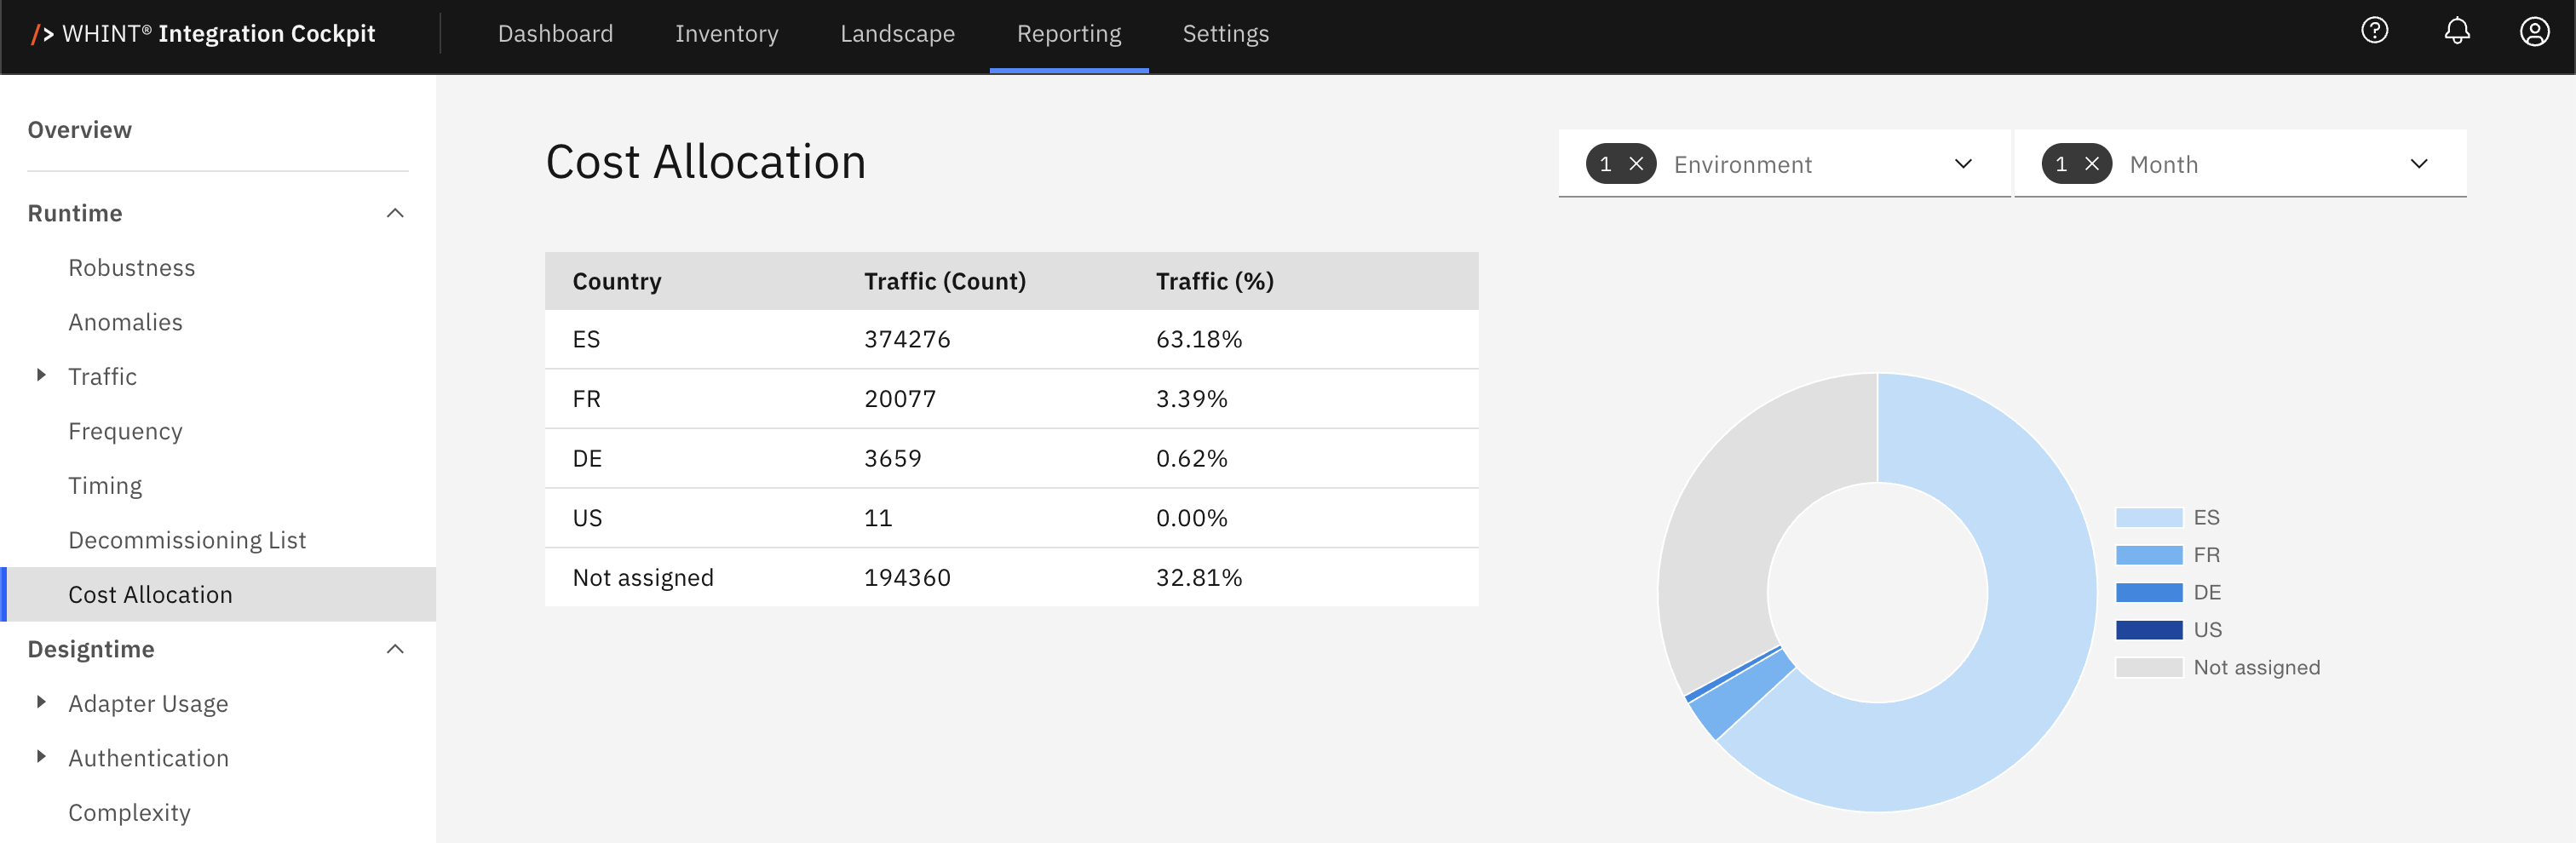
What you see:
-
Traffic distribution table with tag values, counts and percentages
-
Clickable tag values to view interfaces with specific tags
-
Pie chart visualization with proportional segments
-
Environment filter (Production is default, single selection only)
-
Month filter (defaults to last month, single selection only)
Quick Start
First time using Cost Allocation?
-
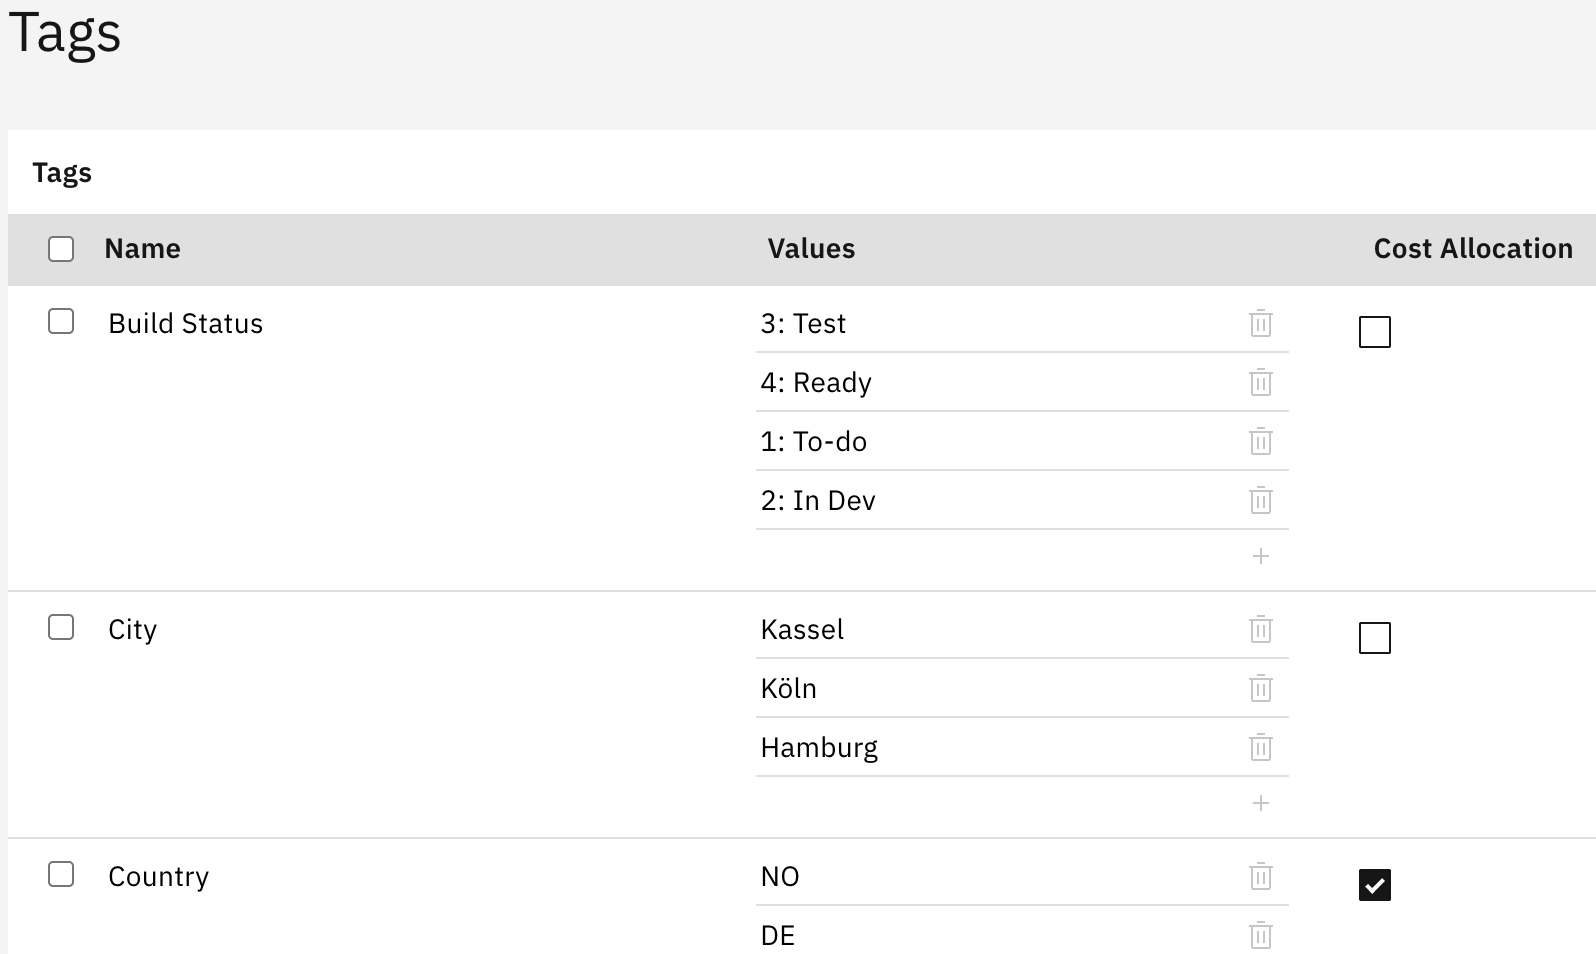
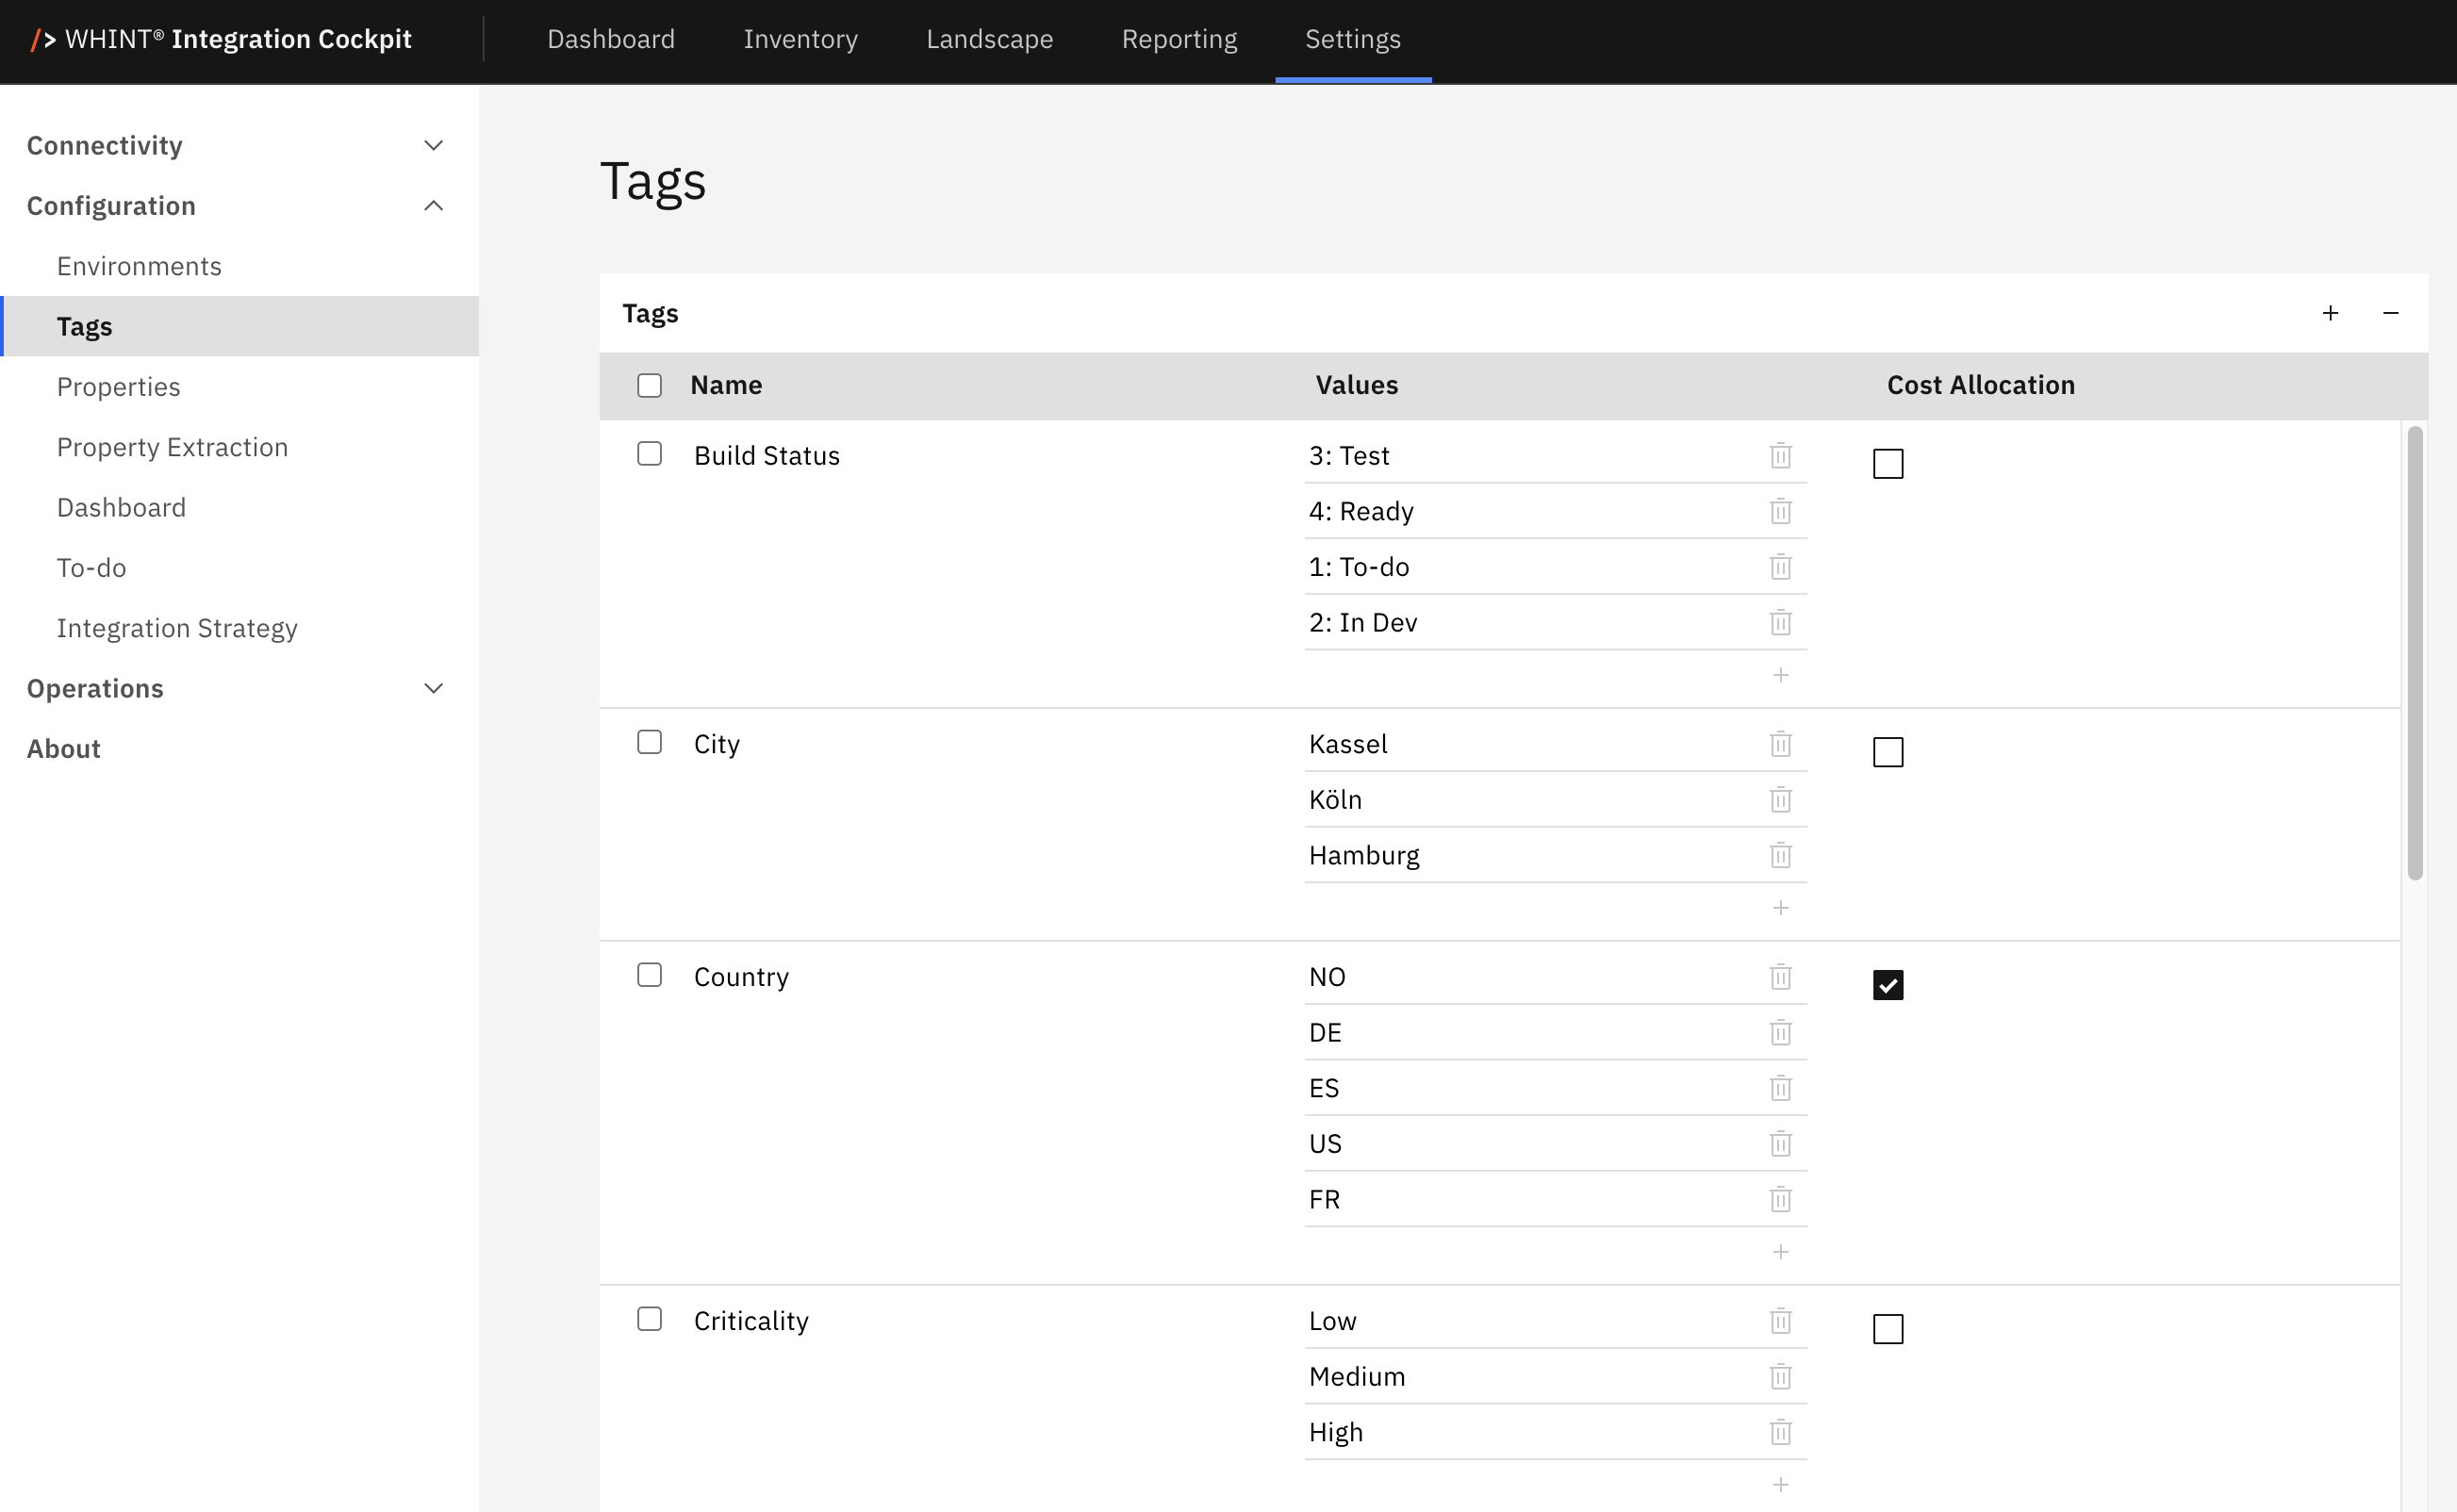
Configure your tag: Navigate to Settings → Configuration → Tags
Check Cost Allocation checkbox for Country, Domain or your designated tag
-
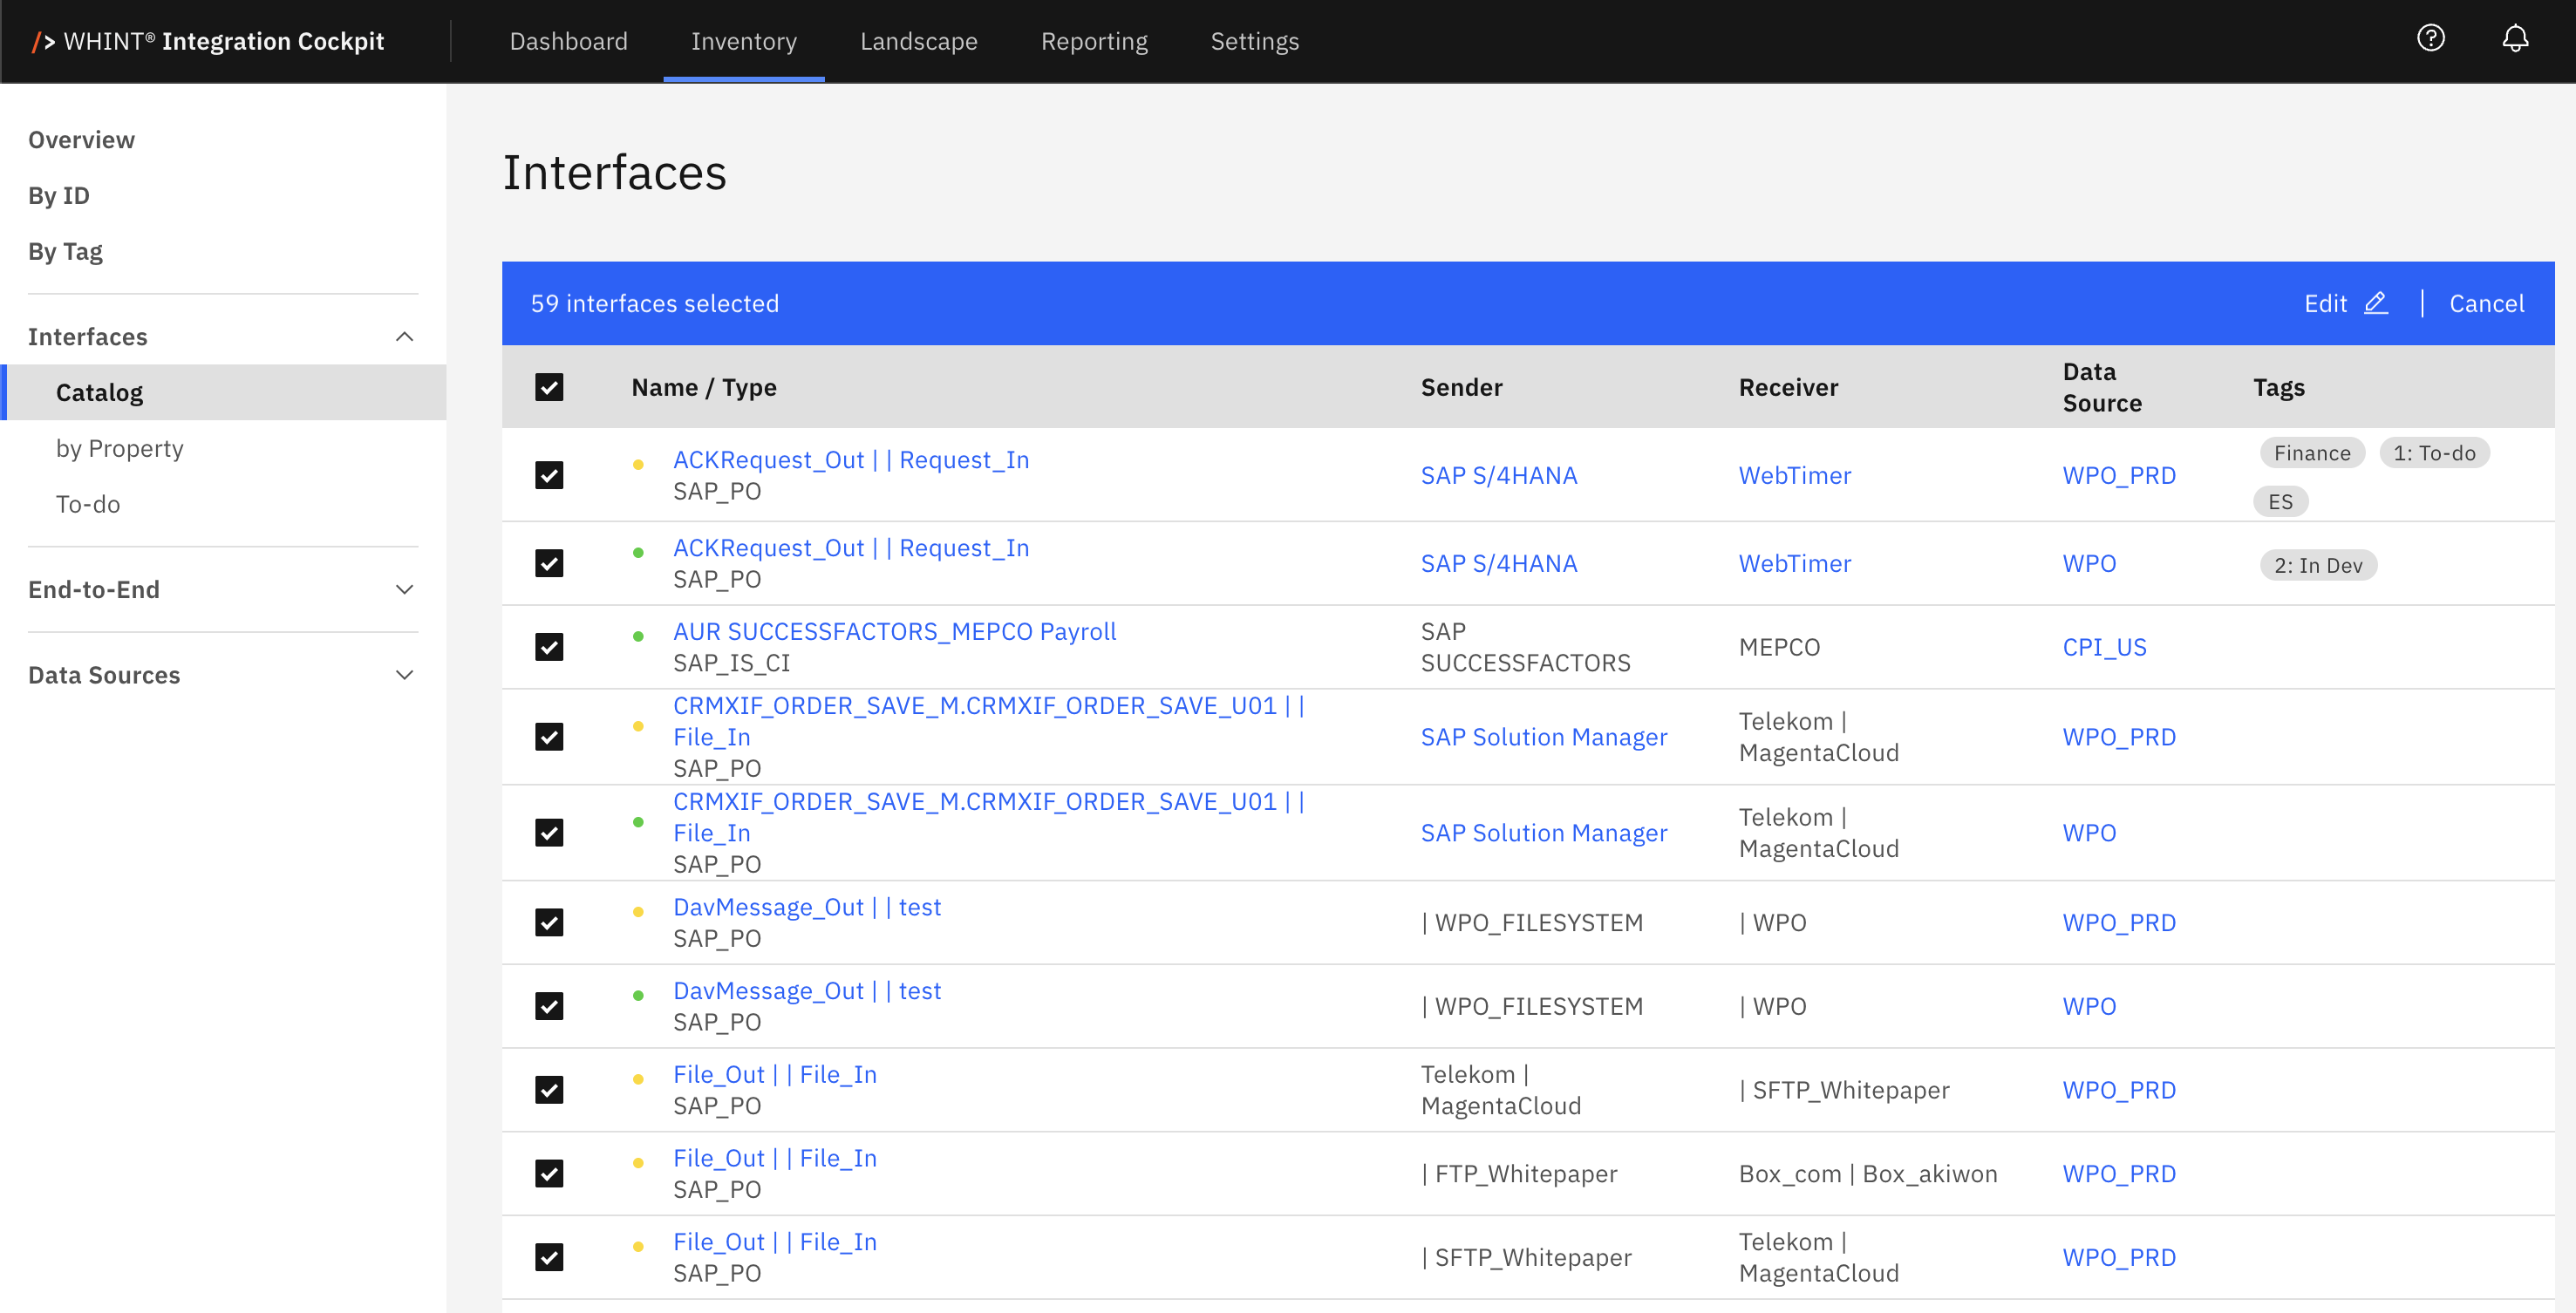
Assign tags to interfaces: Navigate to Inventory → Interfaces → Catalog
Click the edit icon
-
View traffic distribution: Navigate to Reporting → Cost Allocation
Displays traffic breakdown by tag
-
Check percentages: Use Traffic % to allocate monthly platform costs to business units
Example: €50,000/month platform costs → Finance shows 35% traffic → Allocates €17,500 to Finance department.
Configuration and Setup
Configuration Requirement
Before using Cost Allocation, configure which tag category drives traffic grouping.
Navigate to Settings → Configuration → Tags and check the Cost Allocation checkbox next to your desired tag category (e.g. Country, Domain, Business Unit).
Only one tag can be selected for Cost Allocation at a time.
Tags configuration showing Cost Allocation checkbox selected for Country tag category
For detailed tag configuration guidance, see Tags and Onboarding Guide - 2.1.2 Tags.
Tag Selection Strategy
Choose a tag category that aligns with your cost allocation goals:
-
Country: Geographic traffic distribution and regional cost allocation
-
Domain: Business function traffic patterns (Finance, Sales, HR)
-
Business Unit: Departmental usage and chargeback calculations
-
Criticality: Risk-weighted traffic analysis
Recommendation for integration experts: Start with Domain or Business Unit - financial teams understand departmental allocation better than geographic distribution.
Changing the selected tag replaces the current Cost Allocation configuration.
Tag Assignment
Interfaces must have tag values assigned before appearing in Cost Allocation groupings.
Assign tags directly in the interface catalog:
-
Navigate to Inventory → Interfaces → Catalog
-
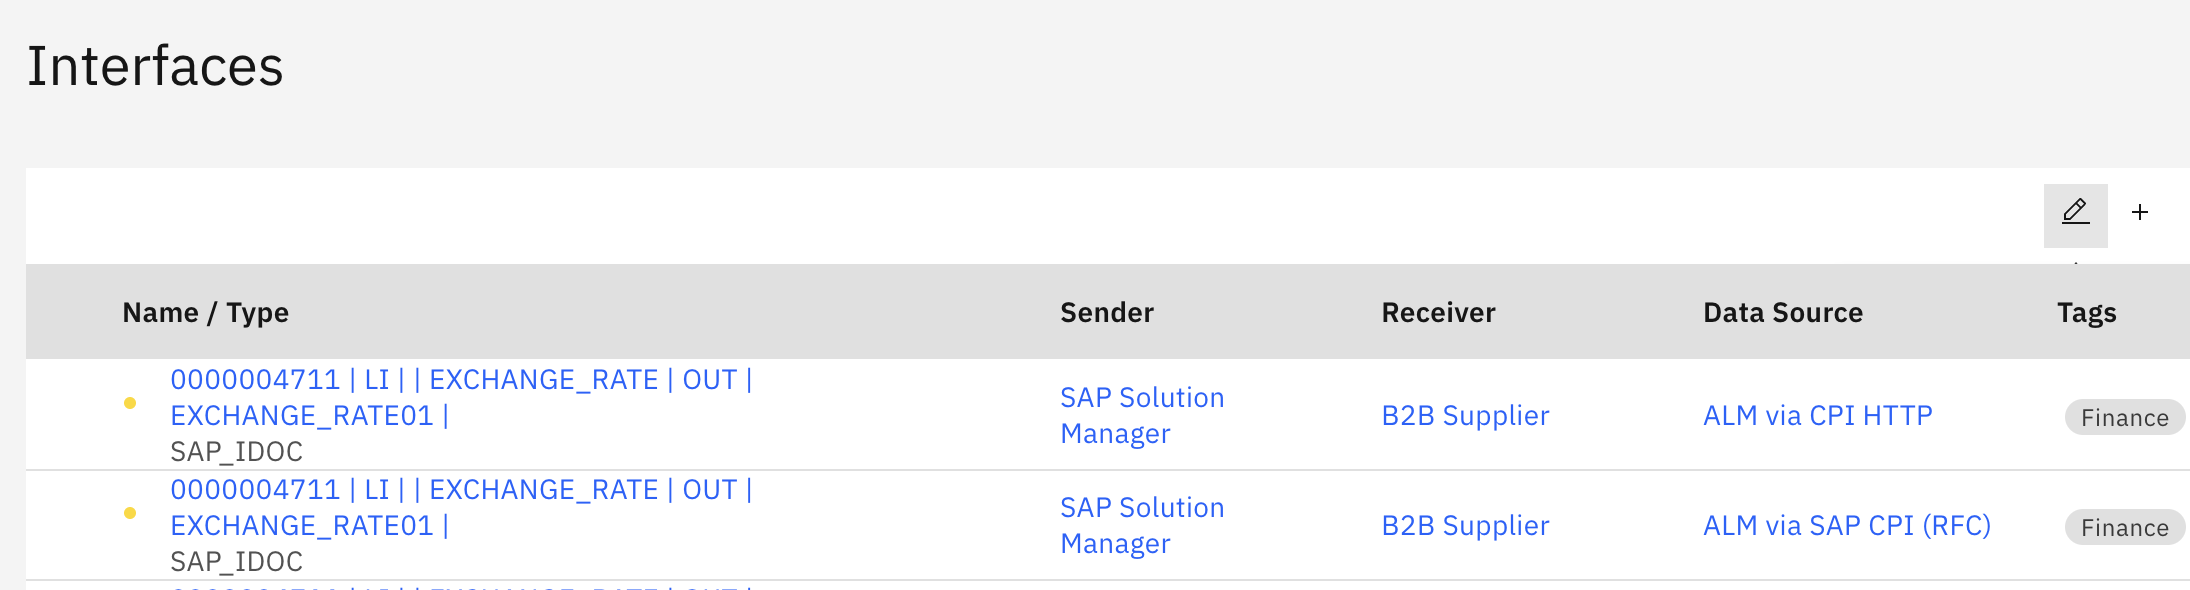
Click the edit icon for any interface to assign or edit tag values:
-
Interface Catalog showing edit icon for tag assignment:
-
Select multiple interfaces and click the edit icon to assign tags in bulk - ideal for newly discovered interfaces:
Tags can also be assigned in:
-
Inventory → End-to-End → Catalog for complete integration flows
For detailed tag assignment strategies, see Onboarding Guide - 2.1.2 Tags.
Understanding Cost Allocation Display
The table and chart provide insights into traffic distribution across tag values:
|
Display Element |
Description |
Purpose |
|---|---|---|
|
Tag Value |
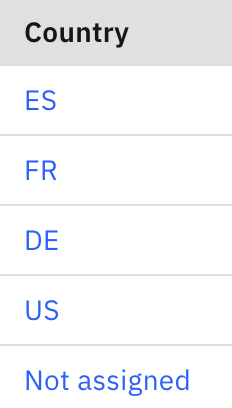
Clickable values from your configured tag category (e.g. ES, FR, DE) |
Identify traffic segments |
|
Traffic (Count) |
Total message count for this tag value in selected month |
Quantify actual usage |
|
Traffic (%) |
Percentage of total monthly traffic |
Calculate proportional allocation |
|
Not assigned |
Interfaces without this tag applied |
Identify untagged interfaces |
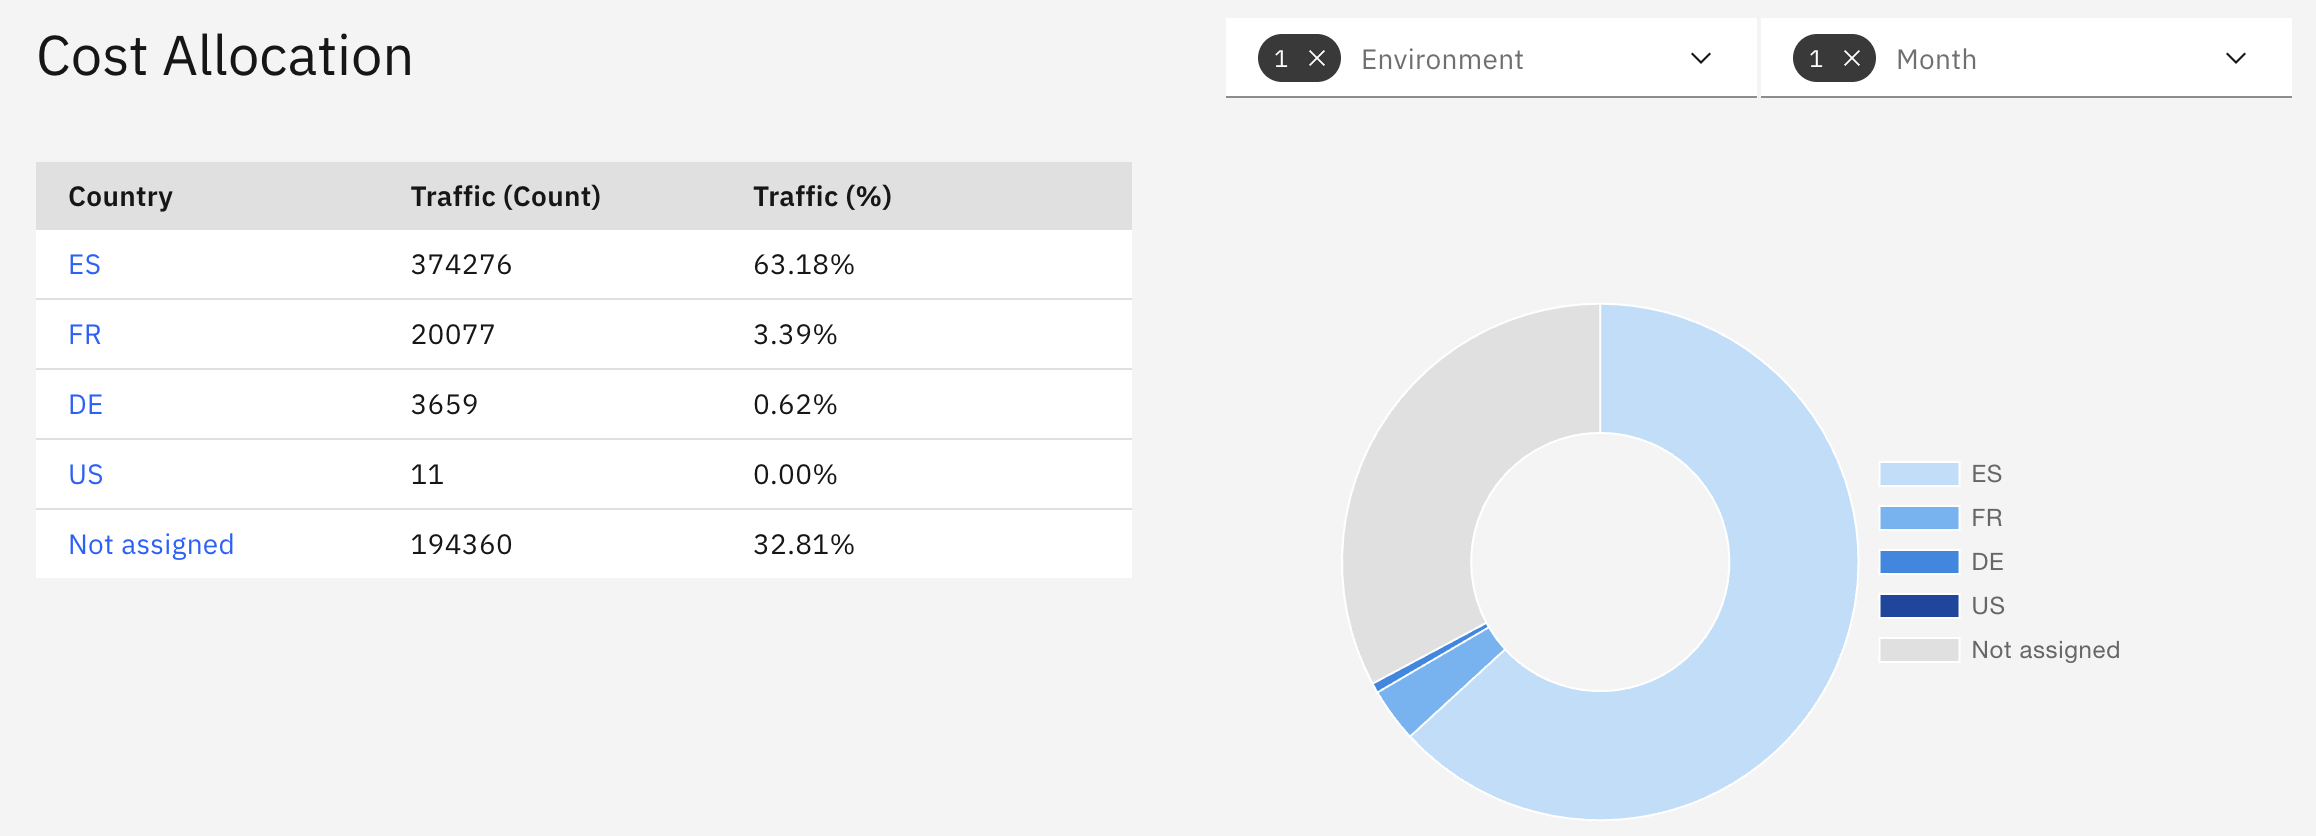
Using Tag Values to View Interfaces
Clicking a tag value opens the Interfaces → Catalog view with automatic filtering applied.
This allows you to:
-
Drill down into specific segments to review interface composition
-
Validate tag assignments for accuracy
-
Identify which interfaces contribute to each traffic segment
-
Investigate unexpected traffic patterns at the interface level
Pie chart visualization
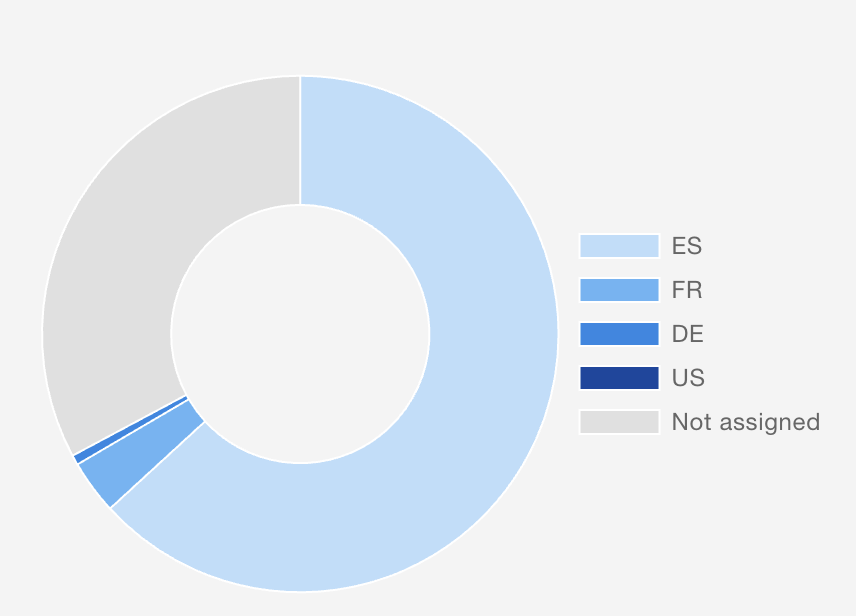
-
Segments sized proportionally to traffic percentage
-
Legend displays all tag values with color coding
-
"Not assigned" segment shows interfaces missing tag assignment in the selected tag category
-
Visual distribution reveals traffic concentration at a glance
High "Not assigned" traffic prevents accurate cost allocation
Without tag assignment, you cannot fairly distribute costs to business units. A 32% "Not assigned" rate means €16,000 of a €50,000/month platform cost cannot be allocated - leading to inaccurate chargeback and budget planning.
Action: Navigate to Inventory → Interfaces → Catalog, select untagged interfaces and click the edit icon to assign appropriate tag values (works for single or multiple interfaces).
Target: <10% not assigned for reliable cost allocation.
Traffic Calculation Method
Cost Allocation calculates traffic percentages using the selected month's total message volume:
Formula: (Tag Value Traffic / Total Monthly Traffic) × 100 = Traffic %
Example Calculation:
-
Total monthly traffic: 592,383 messages
-
ES traffic: 374,276 messages
-
ES percentage: (374,276 / 592,383) × 100 = 63.18%
The Not assigned row always appears last, representing interfaces without the selected tag value applied.
Filter Usage
Environment Filter:
-
Select one environment to analyze (Production, Test, Development)
-
Production is the default for operational cost allocation
Month Filter:
-
Only one month can be selected for clear percentage calculations
-
Defaults to last month for consistent monthly reporting
Important: Month-by-month comparison requires running separate reports and tracking changes manually. Document baseline before migrations or architectural changes.
Using Cost Allocation
Cost Allocation helps you:
-
Support financial chargeback and showback by allocating platform costs based on actual message traffic - enabling transparent IT cost distribution
-
Understand business usage patterns across organizational units, regions, or functional domains - identifying which departments drive integration activity
-
Identify optimization opportunities where traffic concentration indicates need for regional infrastructure, caching strategies, or architecture improvements
-
Prioritize monitoring and support based on business unit importance - using traffic % to justify enhanced attention for high-volume segments
Example: Monthly Cost Allocation and Chargeback
Scenario: IT Finance allocates integration platform costs to business units based on actual usage.
Workflow:
-
Configure Cost Allocation tag: Settings → Configuration → Tags → Check Domain or Business Unit
-
Navigate to Reporting → Cost Allocation
-
Select Environment: Production and Month: [Last Closed Month]
-
Document traffic percentages per business unit
-
Apply percentages to monthly platform costs (licensing, infrastructure, support)
-
Share allocation report with business stakeholders for transparency
Example:
-
Platform costs: €50,000/month
-
Finance domain: 35% traffic → €17,500
-
Sales domain: 28% traffic → €14,000
-
HR domain: 15% traffic → €7,500
-
Not assigned: 22% traffic → €11,000 (redistribute after tag assignment)
Business impact: Transparent IT cost distribution, departmental budget accountability, data-driven IT investment decisions.
Navigation
Access Cost Allocation:
Navigate to Reporting → Cost Allocation from the main navigation menu
Configuration access:
Navigate to Settings → Configuration → Tags to select or change the Cost Allocation tag
Tag assignment:
Navigate to Inventory → Interfaces → Catalog, select interfaces (single or multiple) and click the edit icon to assign or edit tags
Navigate to Inventory → End-to-End → Catalog to assign tags to complete integration flows
Deactivate Cost Allocation on Dashboard:
Navigate to Settings -> Configuration -> Dashboard to deactivate the panel on the Dashboard
Related Documentation
For comprehensive cost allocation and tag configuration:
-
For comprehensive cost allocation and tag configuration:
-
Tags — Define and manage tag categories and values, configure Cost Allocation tag selection
-
Onboarding Guide - 2.1.2 Tags — Tag strategy, business alignment guidance, and advanced classification patterns
-
Traffic — Detailed message traffic analysis by interface and data source
-
Inventory → Interfaces → Catalog — Assign and manage interface tags (select interfaces and click edit icon)
-
Frequency — Interface execution frequency analysis - combine with Cost Allocation for criticality assessment
-
Complexity — Interface technical complexity - combine with Cost Allocation to identify simplification candidates
-
Robustness — Interface stability metrics - combine with Cost Allocation to prioritize improvements
-
Dashboard — Use tags for inventory filtering and dashboard organization
-
Last Updated: October 24, 2025