
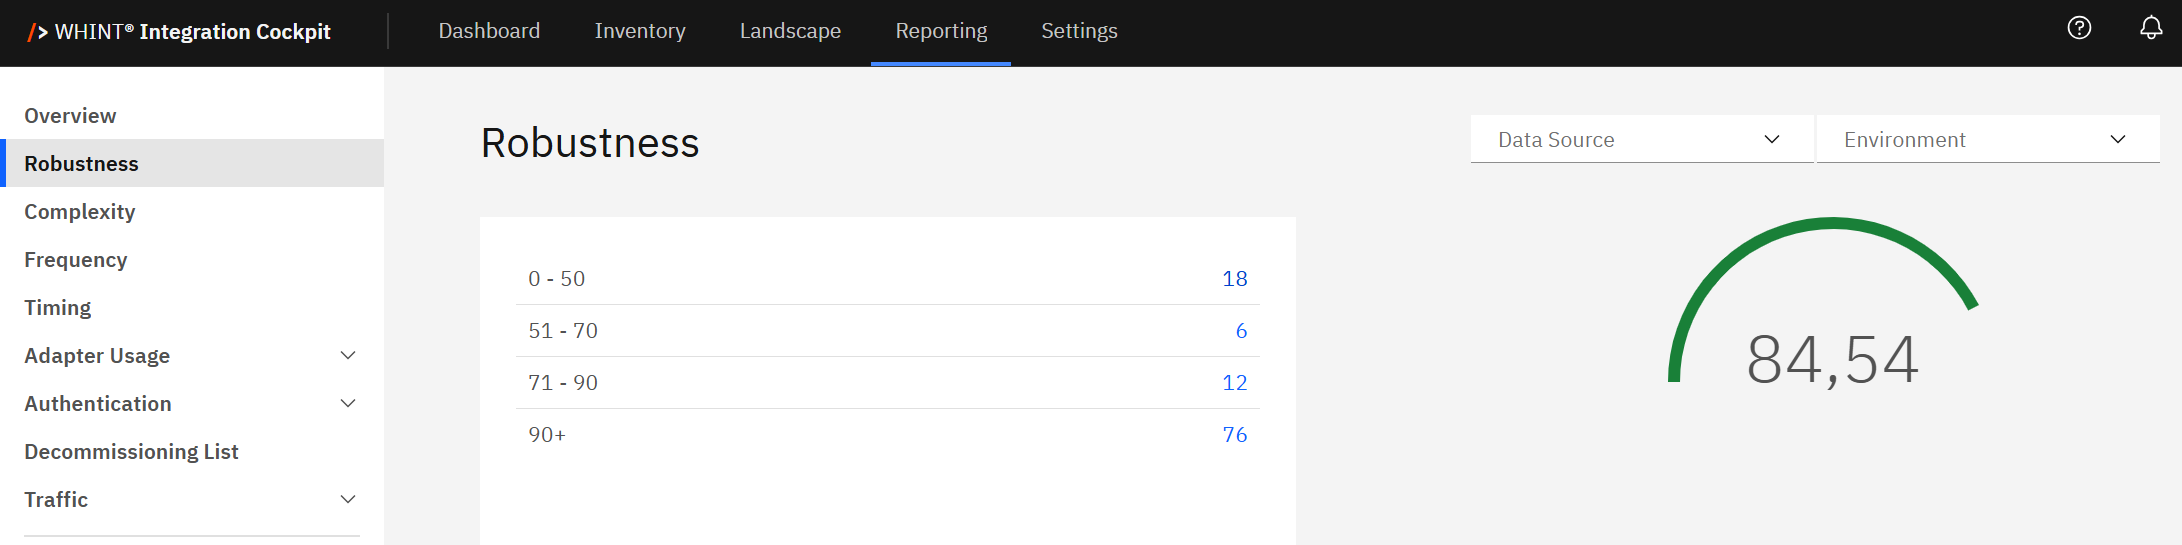
The Robustness view provides detailed analysis of interface stability across your integration landscape over the last 30 days. Use this view to identify problematic interfaces, track stability improvements and prioritize maintenance efforts based on performance data.
Navigate to Reporting → Robustness to access interface stability analytics with filtering and drill-down capabilities.
Need to configure robustness thresholds?
See Onboarding Guide - 2.2.2 Robustness for threshold configuration steps.
Robustness Overview
Robustness shows interface stability over the last 30 days, measuring how consistently interfaces perform without errors or failures.
What you see:
-
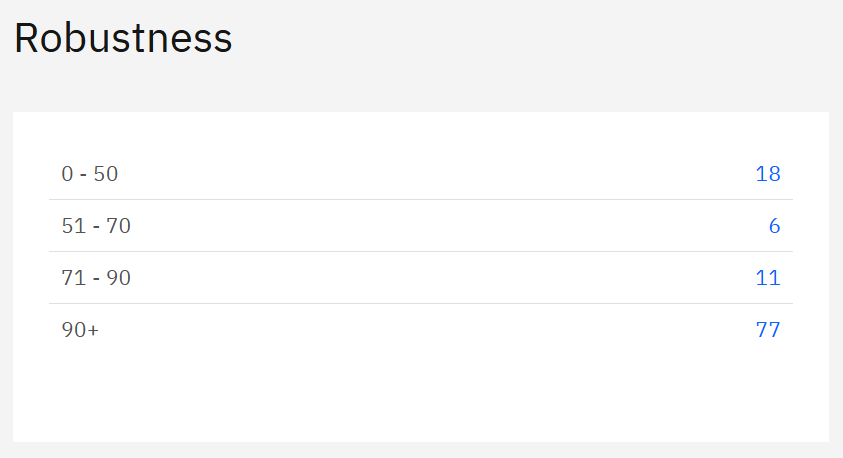
Interface distribution table with robustness score ranges and interface counts
-
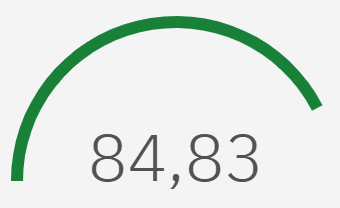
Overall robustness score gauge displaying landscape-wide stability metric (e.g. 84.54)
-
Data Source filter to analyze specific integration platforms
-
Environment filter to switch between e.g. Production, Test, Development views
Using Robustness Interface Counts
Robustness score ranges categorize interfaces by stability performance.
How to use the interface counts:
Click blue interface count links to filter and view specific interfaces:
-
Click "18" (0-50 range) → Shows low robustness interfaces needing immediate attention
-
Click "6" (51-70 range) → Displays medium robustness interfaces for monitoring
-
Click "12" (71-90 range) → Lists high robustness interfaces with minor optimization opportunities
-
Click "76" (90+ range) → Shows very high robustness interfaces to use as stability benchmarks
Navigation workflow:
-
Identify problem areas - Click low robustness counts (0-50, 51-70) first
-
Analyze interface details - Review specific interfaces causing stability issues
-
Compare with benchmarks - Click high robustness counts (90+) to see best practices
-
Track improvements - Monitor changes in distribution over time
Overall Robustness Score
The circular gauge displays your landscape-wide robustness score (e.g. 84.54), providing an immediate health indicator for integration stability.
Score interpretation:
-
90+: Excellent overall stability
-
70-89: Good stability with room for improvement
-
50-69: Moderate stability requiring attention
-
Below 50: Poor stability needing immediate action
Use the overall score to:
-
Track trends over time periods (weekly, monthly, quarterly)
-
Compare environments (Production vs. Test stability)
-
Report to stakeholders with a single, clear stability metric
-
Set improvement targets for integration landscape health
Filtering and Analysis
Data Source Filter:
-
Filter robustness analysis by specific integration platforms
-
Compare stability across different technology stacks
-
Identify platform-specific stability patterns
Environment Filter:
-
Switch between your created environments e.g. Production, Test, and Development
-
Compare stability across different landscape tiers
-
Validate that test environments reflect production stability
Analysis workflow:
-
Start with Production environment to assess business-critical stability
-
Filter by data source to identify platform-specific issues
-
Compare with Test environment to validate deployment stability
-
Use interface count drill-downs to investigate specific problem areas
Business Impact and Actions
Low robustness interfaces (0-70 ranges):
-
Immediate priority for development teams
-
Potential business disruption risk
-
Increased support overhead and maintenance costs
High robustness interfaces (71+ ranges):
-
Success patterns to replicate across other interfaces
-
Stable foundations for business process automation
-
Reference architectures for new interface development
Recommended actions:
-
Daily monitoring of interfaces in 0-50 range
-
Weekly review of medium robustness (51-70) interfaces
-
Root cause analysis for consistently low-performing interfaces
-
Best practice documentation from high-performing interfaces (90+)
Related Documentation
For comprehensive robustness setup and advanced analysis:
-
Onboarding Guide - 2.2.2 Robustness - Configure robustness thresholds and scoring parameters
-
Dashboard Overview - Robustness - Complete robustness methodology and interpretation guide
Last Updated: August 22, 2025