
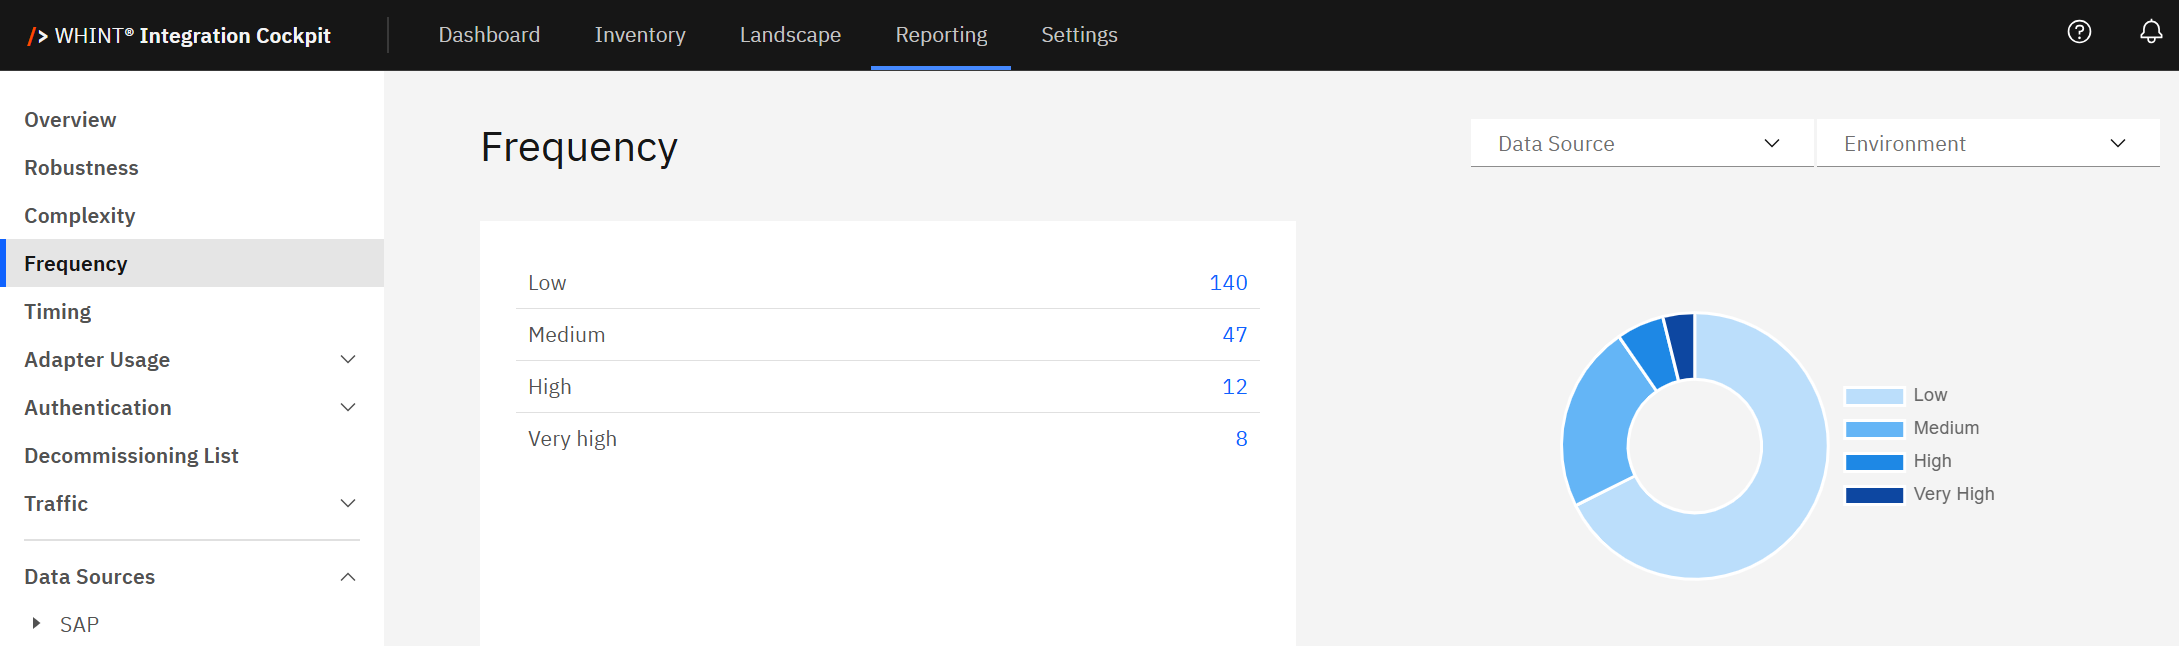
The Frequency view measures how actively your interfaces are being used by analyzing execution frequency over the past 30 days. Use this analysis to identify high-traffic business-critical interfaces, detect underused or inactive interfaces and plan resources based on actual usage patterns.
Navigate to Reporting → Frequency to access interface activity analytics with interactive pie chart visualization and filtering capabilities.
Want to understand how frequency works?
See Dashboard Overview - Frequency for detailed methodology and traffic analysis
Frequency Overview
Frequency measures how often each interface is executed within the monitored period (past 30 days), providing a quick overview of runtime activity across your integration landscape.
What you see:
-
Interface distribution table with frequency categories and clickable blue count numbers
-
Interactive pie chart with hoverable segments showing exact counts
-
Data Source filter to analyze specific integration platforms
-
Environment filter to switch between Production, Test, Development views
Using Frequency Categories
Frequency classification automatically categorizes interfaces into four levels based on message volume over the past 30 days:
|
Frequency Level |
Description |
Business Impact |
|---|---|---|
|
Low |
Minimal execution activity |
May indicate limited business relevance or outdated use |
|
Medium |
Moderate activity levels |
Standard operational interfaces |
|
High |
Frequent execution |
Active business processes requiring attention |
|
Very High |
Highest activity levels |
Business-critical interfaces needing extra monitoring |
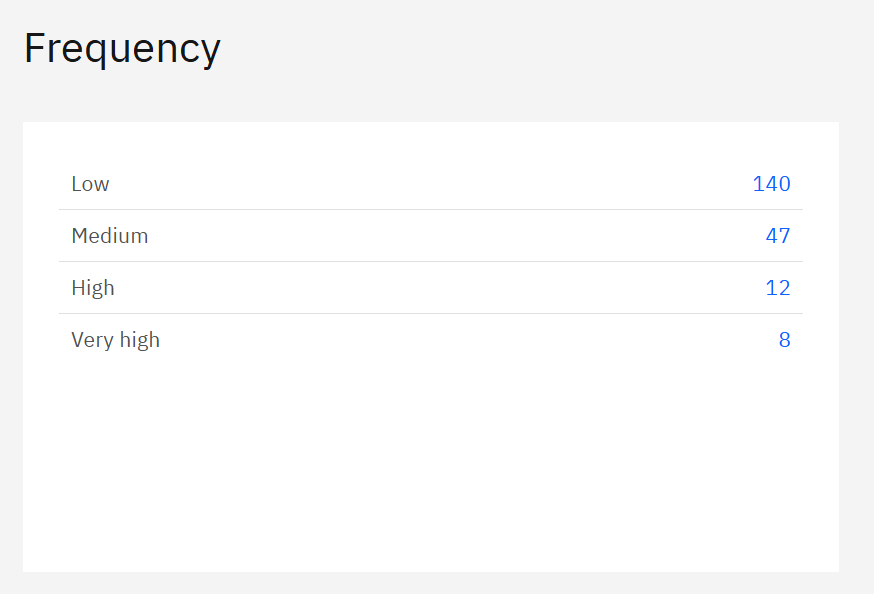
How to use the interface counts:
Click blue interface count numbers to filter and view specific interfaces:
-
Click "140" (Low) → Shows minimally used interfaces that may need review for decommissioning
-
Click "47" (Medium) → Displays moderately active interfaces for standard monitoring
-
Click "12" (High) → Lists frequently used interfaces requiring performance attention
-
Click "8" (Very High) → Shows business-critical interfaces needing enhanced monitoring
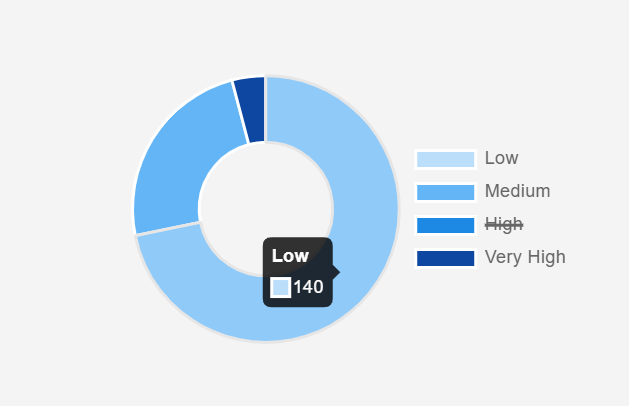
Interactive pie chart features:
-
Hover over segments to see exact interface counts (e.g. "Low: 140")
-
Click pie chart segments for same filtering as blue numbers
-
Click legend items (Low, Medium, High, Very High) to strike out and filter out those categories from the view
-
Visual distribution shows activity balance across your landscape
Navigation workflow:
-
Assess activity distribution - Use pie chart hover to see exact counts per frequency level
-
Investigate high-activity interfaces - Click blue numbers "12" (High) and "8" (Very High) first
-
Review low-activity interfaces - Click "140" (Low) to identify candidates for decommissioning
-
Monitor critical interfaces - Focus on Very High frequency interfaces for performance optimization
What to Look For
Ideal distribution: Balanced mix across frequency levels with clear identification of business-critical (Very High) and potentially unused (Low) interfaces.
High low-frequency concentration: Many Low frequency interfaces suggest potential for landscape cleanup and decommissioning efforts.
Recommended actions:
-
Low frequency interfaces: Review for business relevance, consider decommissioning inactive interfaces
-
Very High frequency interfaces: Implement enhanced monitoring, performance tuning, and robust error handling
Activity patterns:
-
Very High interfaces typically require custom alert thresholds and infrastructure scaling
-
Low frequency interfaces should be reviewed with other KPIs (Complexity, Decommissioning) to determine retirement candidates
-
Use frequency data to align operational monitoring with business-critical traffic patterns
Frequency Calculation Details:
Frequency classification is calculated using live traffic data over the past 30 days and updated regularly to reflect current usage patterns. The classification helps to:
-
Identify high-traffic, business-critical interfaces that require extra monitoring or safeguards
-
Prioritize monitoring and alerting coverage for high-frequency flows
-
Detect underused or inactive interfaces that may be outdated or no longer needed
-
Plan resources and capacity (scaling, performance tuning) based on interface load
Related Documentation
For comprehensive frequency analysis and capacity planning:
-
Dashboard Overview - Frequency - Complete methodology
Last Updated: August 22, 2025