

The Interface Map shows your integration landscape as a graph. Each node represents a system, and each line represents the interfaces between two systems.
Purpose: Use the Interface Map to see which systems are connected and which system pairs have the most interfaces.
Navigate to Reporting → Landscape → Visualization → Map → Interfaces to open the interface map.
Interface Map Overview
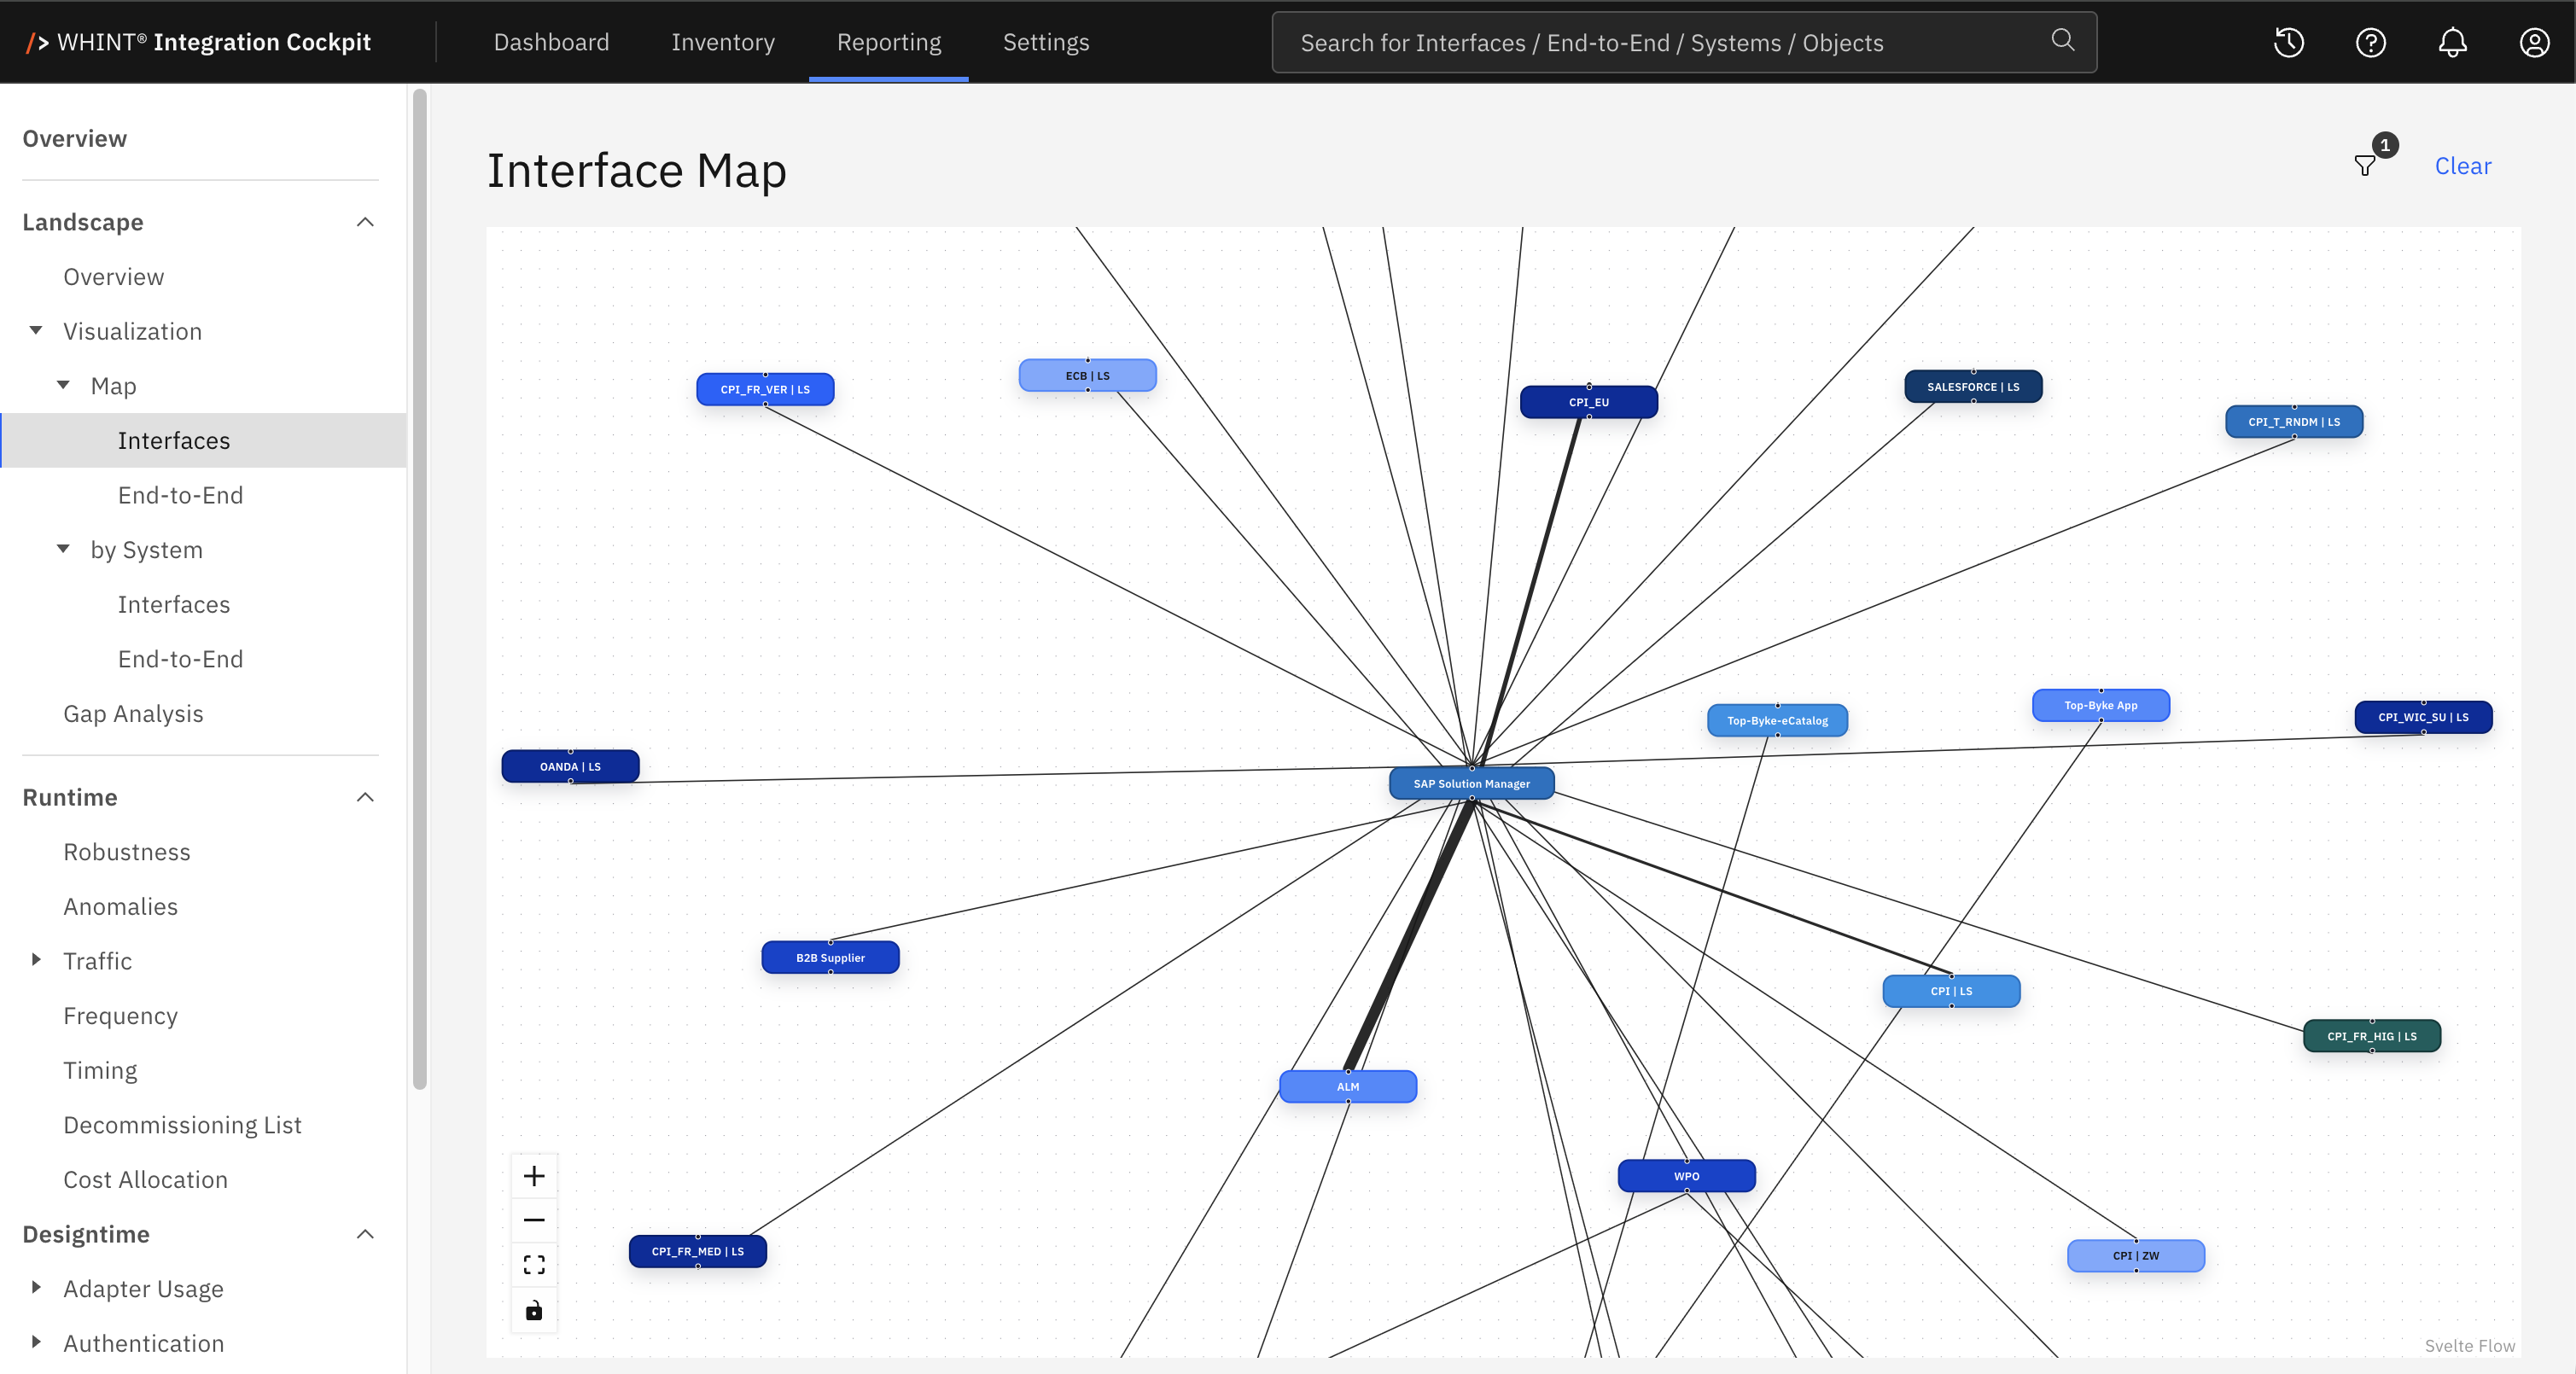
What you see:
-
Node - One system
-
Line - Interfaces between two systems, more interfaces result in a thicker line
-
Filter - The badge shows how many of the three available filters are in use
-
Clear - Removes all active filters and is shown only while a filter is applied
Only systems with at least one interface to another system are shown.
Interfaces whose sender and receiver are the same system are not drawn.
Reading the Map
A line combines both directions. The map shows that two systems exchange data, but not which system is the sender or receiver.
To analyze the direction, use Reporting → Landscape → Visualization → by System, which shows the selected system in separate As Sender and As Receiver graphs.
Line thickness is graded rather than proportional. It increases at 5, 10, 30, 100, and 200 interfaces. Two lines with the same thickness can therefore represent different numbers of interfaces. Click a line to see the exact interfaces behind it.
Node positions are recalculated when the map is opened. Default node colors are assigned automatically and do not indicate a category or status.
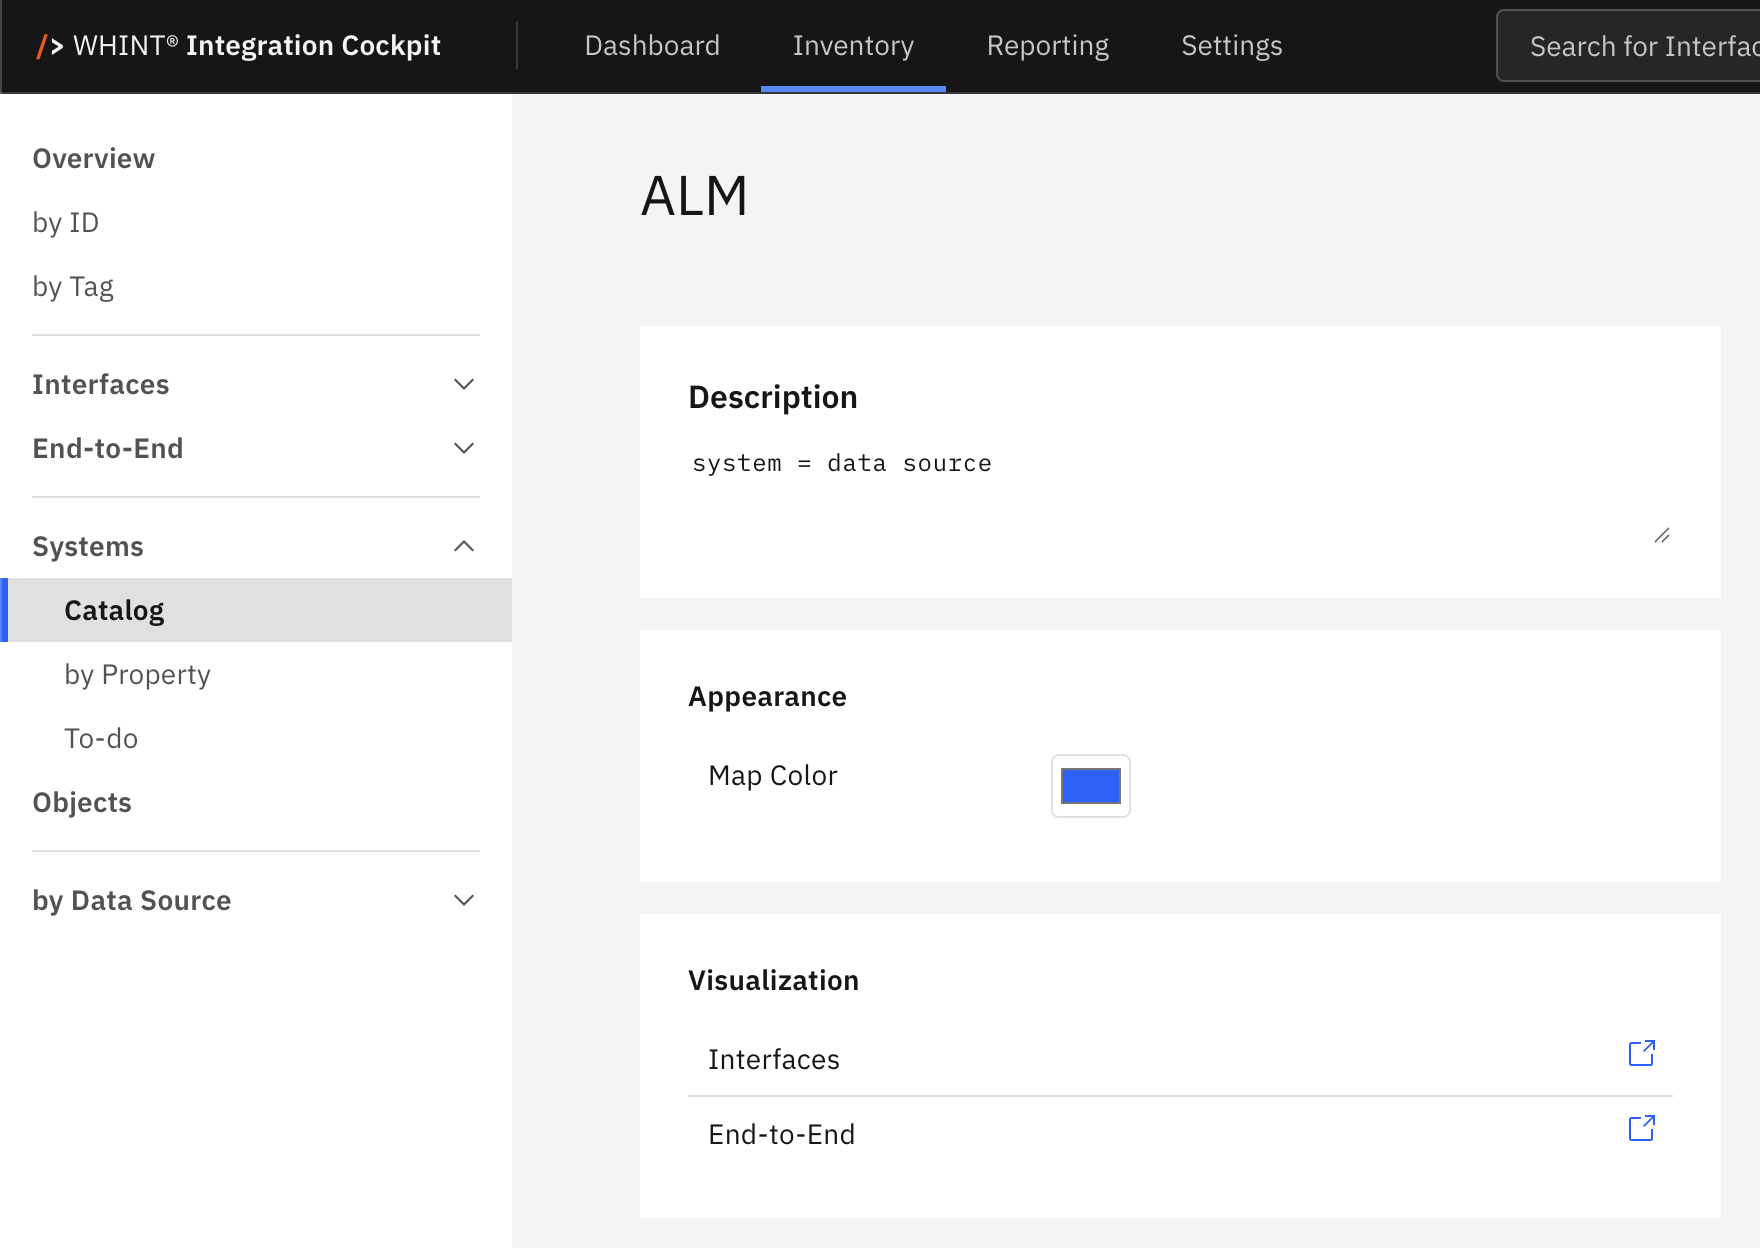
To assign a fixed color to a system, configure Appearance → Map Color under Inventory → Landscape → Systems.
Filters
Open the filters using the funnel icon in the top right.
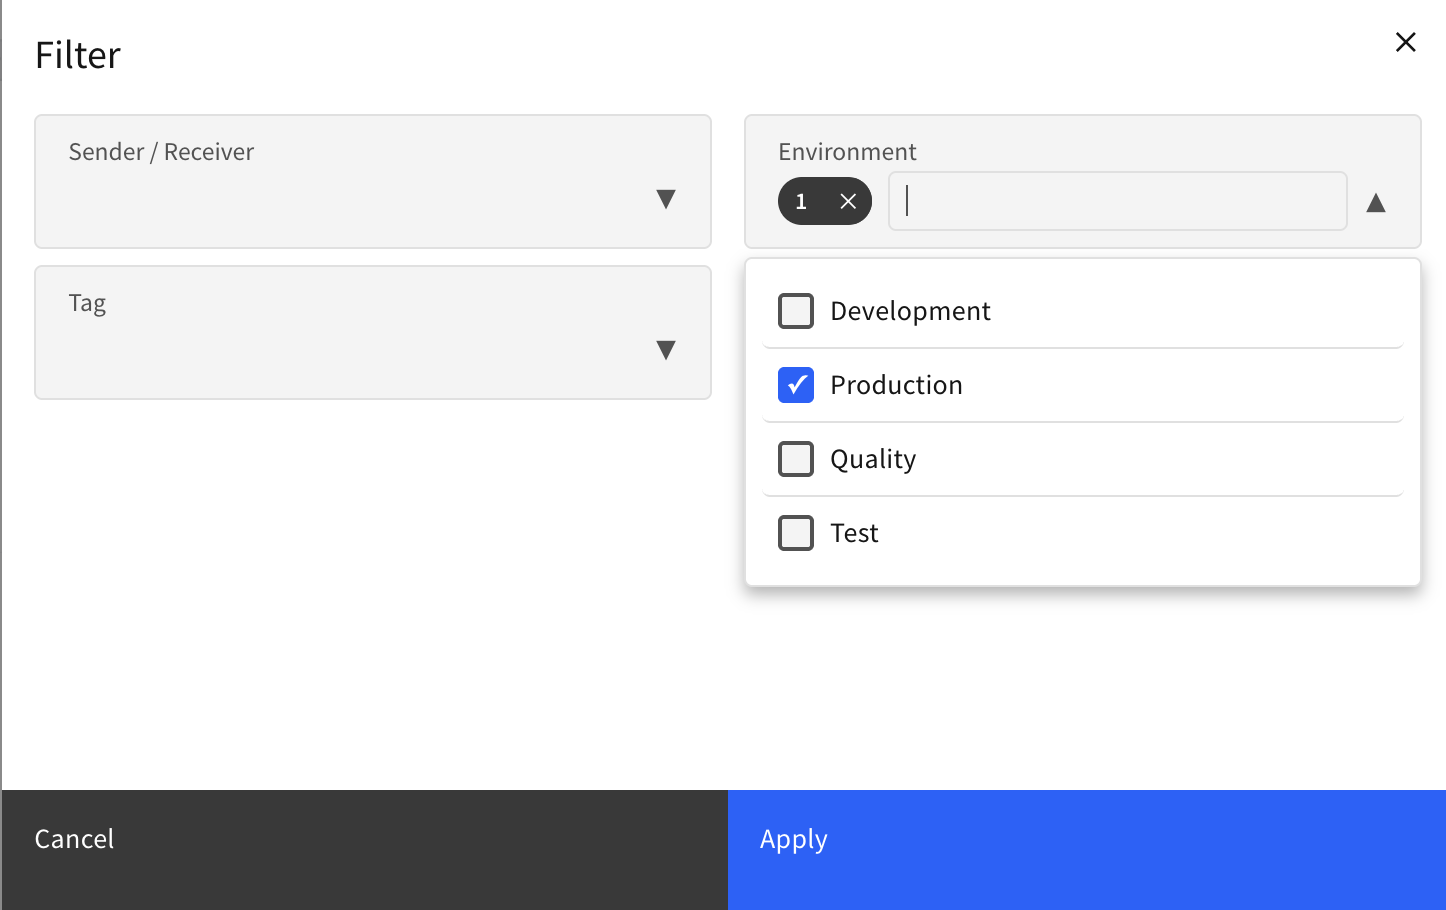
What you see:
-
Sender / Receiver - Systems to include or exclude. Systems belonging to a data source show the data source name in brackets to distinguish systems with the same name
-
Environment - Environments to include or exclude
-
Tag - Tags or individual tag values to include or exclude
The map opens with Production selected.
Each filter can be used to include or exclude entries.
When filtering by Sender / Receiver, the selected systems and the systems directly connected to them remain visible so that the surrounding connections are preserved.
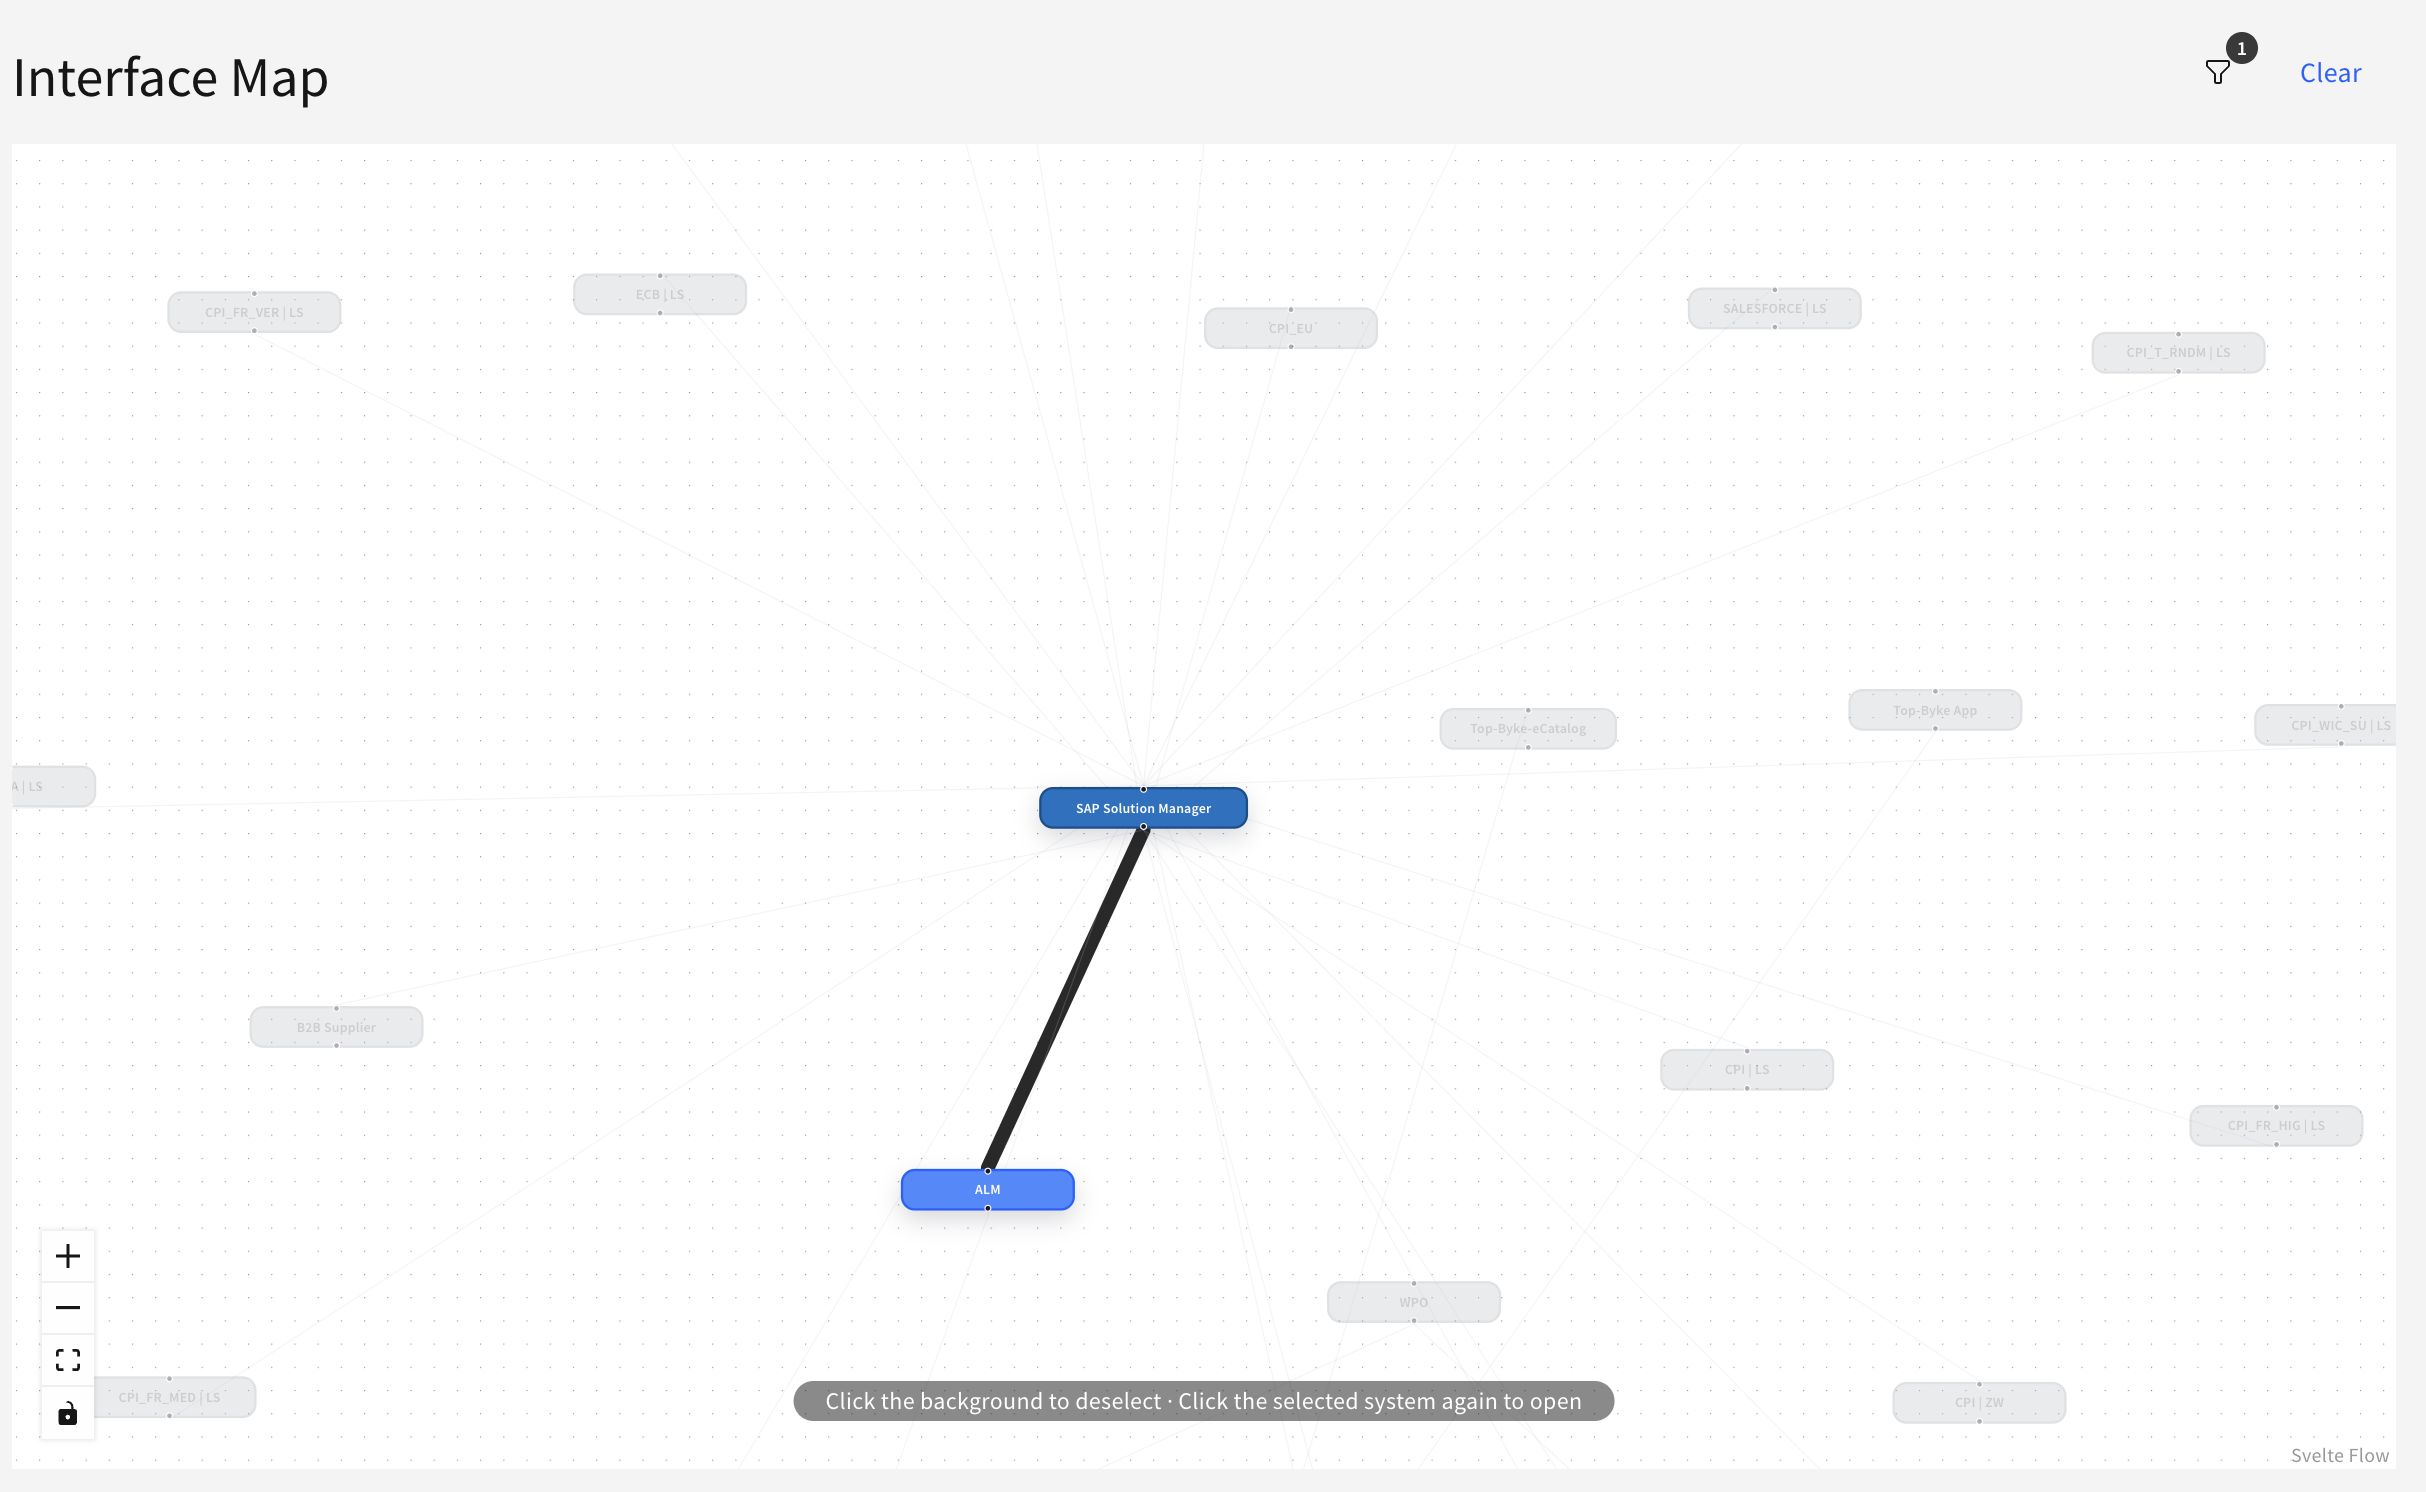
Working with the Map
|
Action |
Result |
|---|---|
|
Click a system |
Highlights the system and its directly connected systems, all other systems are dimmed |
|
Click the selected system again |
Opens the system in the Inventory in a new tab |
|
Click the background |
Removes the current selection |
|
Click a line |
Opens the interfaces between the two systems in the Inventory in a new tab while retaining the Environment and Tag filters |
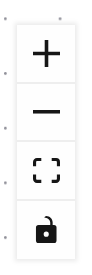
The controls in the lower left corner allow you to:
-
Plus button (+): Zoom in for detailed view of integration flow containers and component relationships
-
Minus button (-): Zoom out for broader end-to-end process overview
-
Fit view button (□): Single click to automatically adjust view to show all integration flows perfectly
-
Lock button: Lock the view to prevent accidental zooming or moving while analyzing complex flows
Related Documentation
-
Reporting → Landscape → Visualization → Map → End-to-End - View the same landscape based on End-to-End integrations
-
Reporting → Landscape → Visualization → by System - Select one system and analyze its senders and receivers separately
-
Reporting → Landscape → Overview - View the landscape counts behind the visualization
-
Inventory → Interfaces - Browse the interface list opened from the map
-
Inventory → Landscape → Systems - View system details and configure the Map Color
-
Settings → Transformation Rules - Configure system harmonization
Last Updated: September 21, 2026