
The Monthly Traffic by Interface view provides detailed interface-level traffic analysis, showing message volumes for individual interfaces across time periods. This view enables you to identify high-traffic interfaces, analyze interface-specific usage patterns and track performance at the most granular level.
Navigate to Reporting → Traffic → Month by Interface to access detailed monthly traffic data by individual interface.
Purpose
Analyze message traffic at the interface level to identify top-performing interfaces, track usage patterns for specific integrations and support interface-level capacity planning and optimization decisions.
Monthly Interface Traffic Overview
Monthly Traffic by Interface displays comprehensive interface-level traffic data in a detailed table format, allowing you to analyze traffic patterns for individual interfaces across your integration landscape.
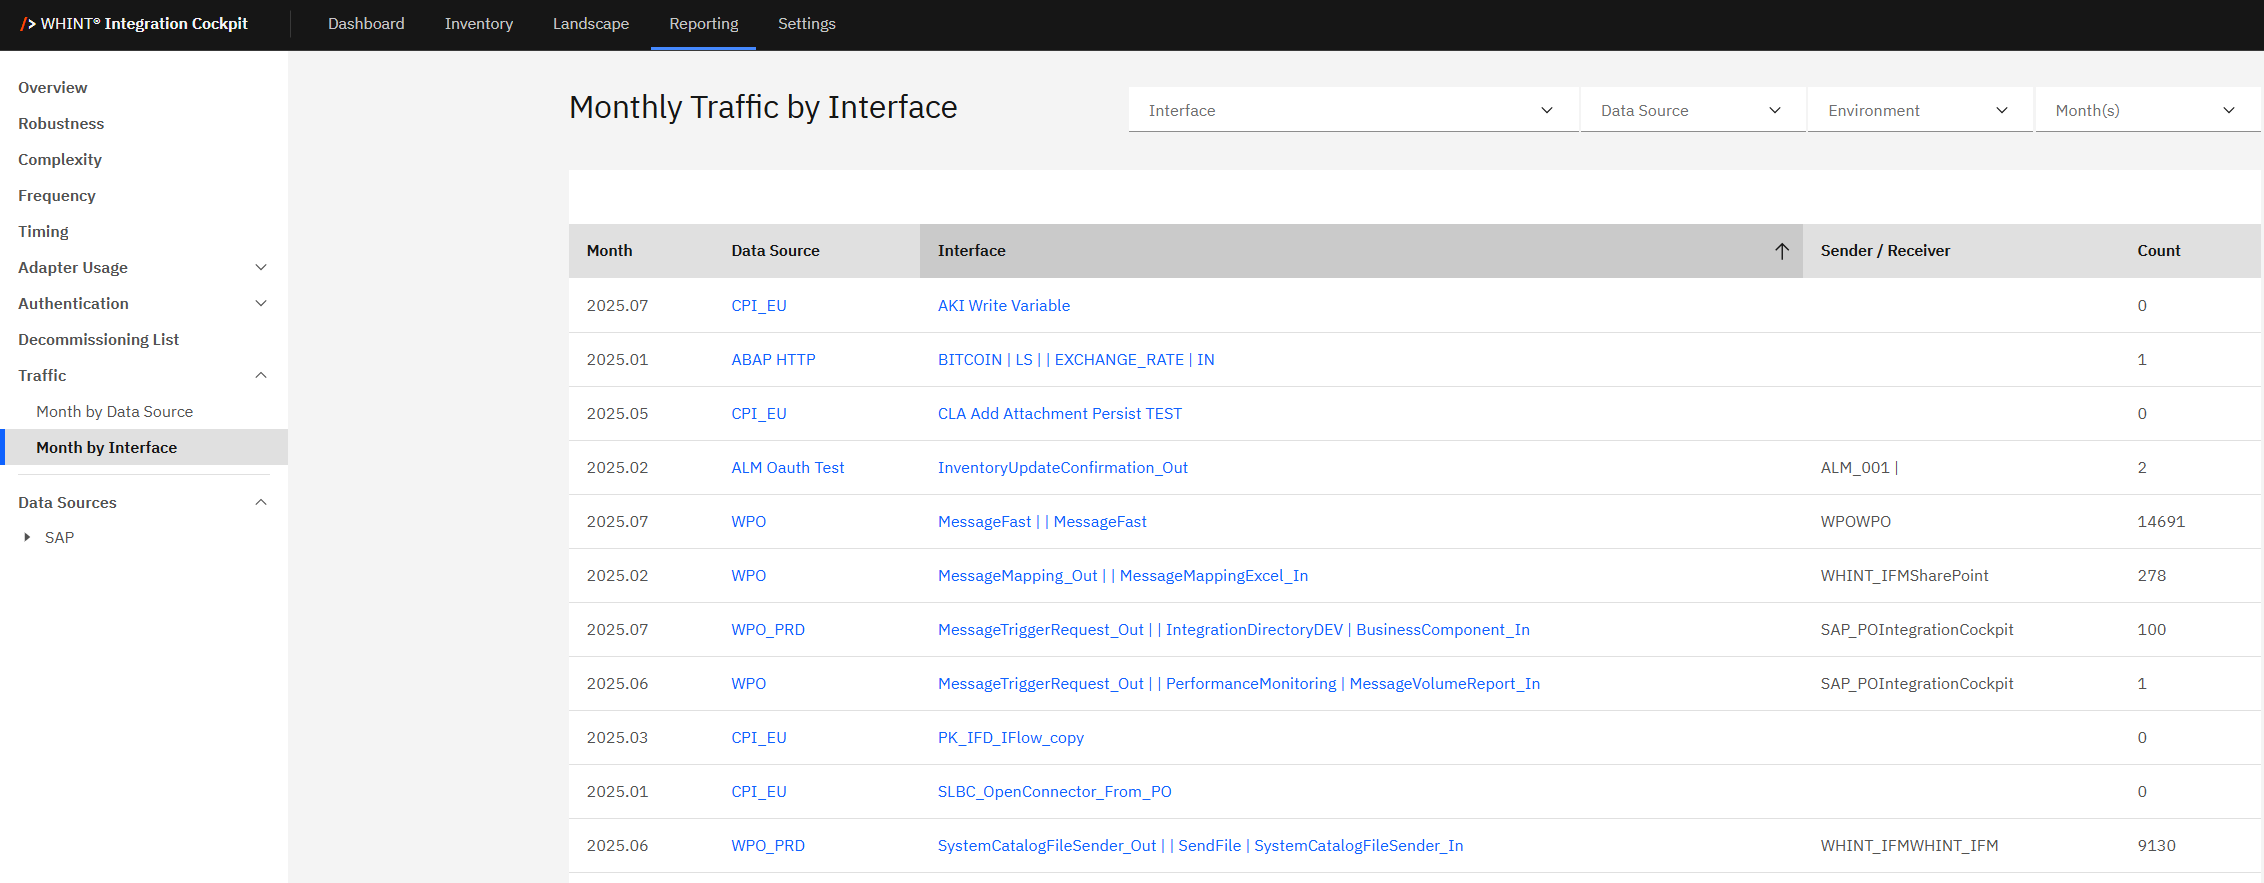
What you see:
-
Detailed traffic table with interface-level message counts
-
Multiple filter options - Interface, Data Source, Environment and Month(s) selection
-
Sortable columns for organizing data by different criteria
-
Clickable links for Data Source and Interface names to navigate to detailed views
-
Sender/Receiver information showing system context for each interface
Using Interface Traffic Data
The interface traffic table provides granular insights into individual interface performance:
|
Column |
Description |
Purpose |
|---|---|---|
|
Month |
Time period for traffic data (YYYY.MM format) |
Track traffic trends over time |
|
Data Source |
Integration platform (clickable blue links) |
Navigate to data source details |
|
Interface |
Interface name (clickable blue links) |
Navigate to interface details |
|
Sender / Receiver |
System context information |
Understand interface endpoints |
|
Count |
Message volume for the time period |
Analyze traffic volumes |
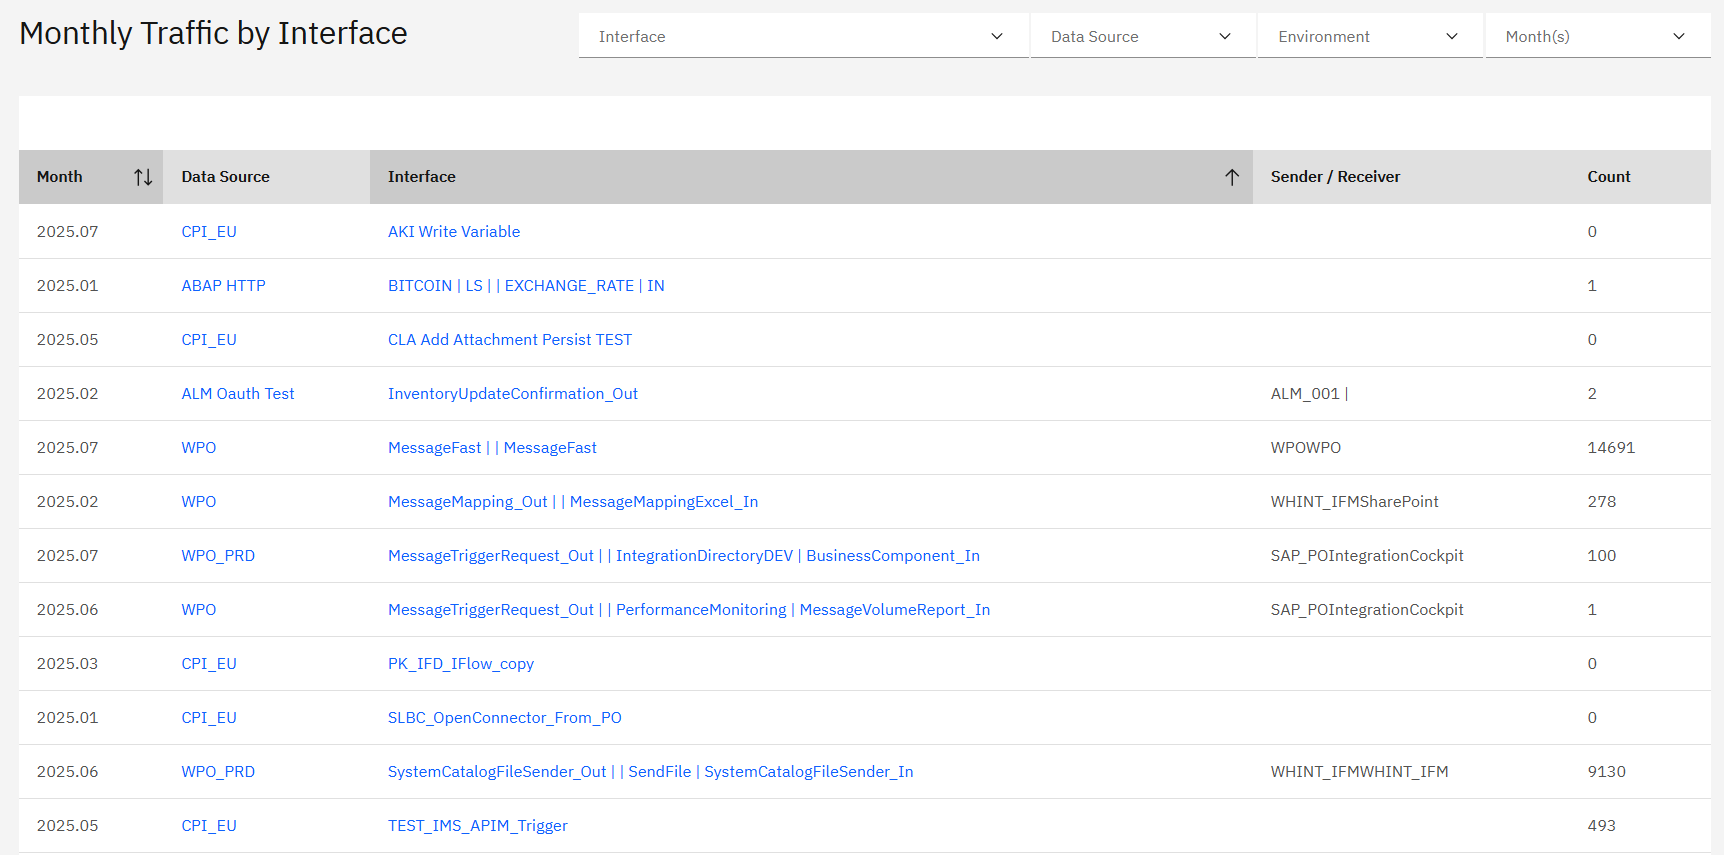
How to interpret interface traffic data:
Interface names (blue links):
-
Click "AKT Write Variable" → Navigate to detailed interface documentation
Data source links (blue links):
-
Click "CPI_EU" → Navigate to Cloud Integration platform details
-
Click "WPO" → View Process Orchestration system information
-
Click "ABAP HTTP" → Access backend system details
Traffic volume analysis:
-
High-volume interfaces (e.g. 14691, 9130 messages) → Critical business processes requiring monitoring
-
Medium-volume interfaces (e.g, 278, 493 messages) → Regular business operations
-
Low/Zero-volume interfaces (e.g. 0, 1, 2 messages) → Candidates for decommissioning review
Filtering and Analysis
Multiple Filter Options:
Interface Filter:
-
Select specific interfaces for focused traffic analysis
-
Useful for tracking critical business interface performance
-
Compare traffic patterns between similar interfaces
Data Source Filter:
-
Filter by integration platform (CPI_EU, WPO, ABAP HTTP, etc.)
-
Analyze platform-specific interface traffic patterns
-
Support platform migration and optimization planning
Environment Filter:
-
Switch between Production, Test, Development environments
-
Compare interface traffic across landscape tiers
-
Validate deployment consistency and usage patterns
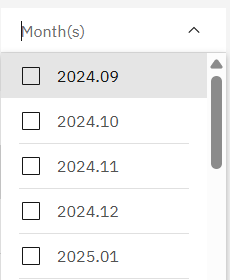
Month(s) Filter:
-
Multiple month selection → Choose specific time periods for analysis (e.g. 2024.09, 2024.10, 2025.01)
-
Time range analysis → Select consecutive months to track trends
-
Seasonal comparison → Compare same months across different years
Sorting and Organization
Column Sorting:
Sortable columns allow you to organize data by different criteria:
-
Month sorting → Organize chronologically or reverse-chronologically
-
Data Source sorting → Group interfaces by platform
-
Interface sorting → Alphabetical interface organization
-
Sender/Receiver sorting → Group by system relationships
-
Count sorting → Identify highest and lowest traffic interfaces
Analysis workflow:
-
Use Month(s) filter to select relevant time periods
-
Apply Interface or Data Source filters for focused analysis
-
Sort by Count to identify high-traffic interfaces
-
Click blue links to drill down into specific interface or platform details
-
Cross-reference Sender/Receiver information for system context
Interface Traffic Insights
Interface-level traffic analysis supports:
Performance Optimization:
-
High-traffic interface identification → Focus optimization efforts on interfaces with highest message volumes
-
Resource allocation → Prioritize monitoring and support for critical interfaces
-
Bottleneck analysis → Identify interfaces that may require performance tuning
Capacity Planning:
-
Interface-specific scaling → Plan capacity increases for individual high-volume interfaces
-
Trend analysis → Use historical data to predict future interface capacity needs
-
Platform balancing → Distribute high-traffic interfaces across available platforms
Business Impact Analysis:
-
Critical process identification → High message counts often indicate business-critical processes
-
Usage pattern analysis → Understand business cycles through interface traffic patterns
-
System dependency mapping → Use Sender/Receiver information to understand system relationships
Operational Monitoring:
-
Interface health monitoring → Regular traffic patterns indicate healthy interface operation
-
Anomaly detection → Unusual traffic spikes or drops may indicate issues
-
Decommissioning candidates → Consistent zero-traffic interfaces may be candidates for removal
Tip
Sort by Count (descending) to quickly identify your highest-traffic interfaces. These interfaces should receive priority attention for monitoring, optimization and capacity planning efforts.
Navigation
Deep dive analysis:
-
Click blue interface names to access detailed interface documentation and configuration
-
Click blue data source names to navigate to platform-specific analysis
-
Use multiple filters simultaneously for targeted analysis
Cross-reference with other KPIs:
-
Compare high-traffic interfaces with Robustness scores to ensure stability
-
Correlate interface traffic with Complexity metrics for resource planning
-
Reference Decommissioning List to validate zero-traffic interface removal candidates
Related Documentation
For comprehensive traffic analysis and monitoring:
-
Dashboard Traffic KPI - Understanding overall traffic metrics and thresholds
Last Updated: August 26, 2025