


Anomalies
The Anomalies section defines the expected message volume per interface, so unusual traffic becomes visible without watching every interface.
Purpose: Define the expected traffic range per interface and period, and let the Cockpit flag interfaces whose actual volume falls outside that range.
Navigate to Settings → Runtime → Anomalies to configure the monitoring.
Anomalies Overview
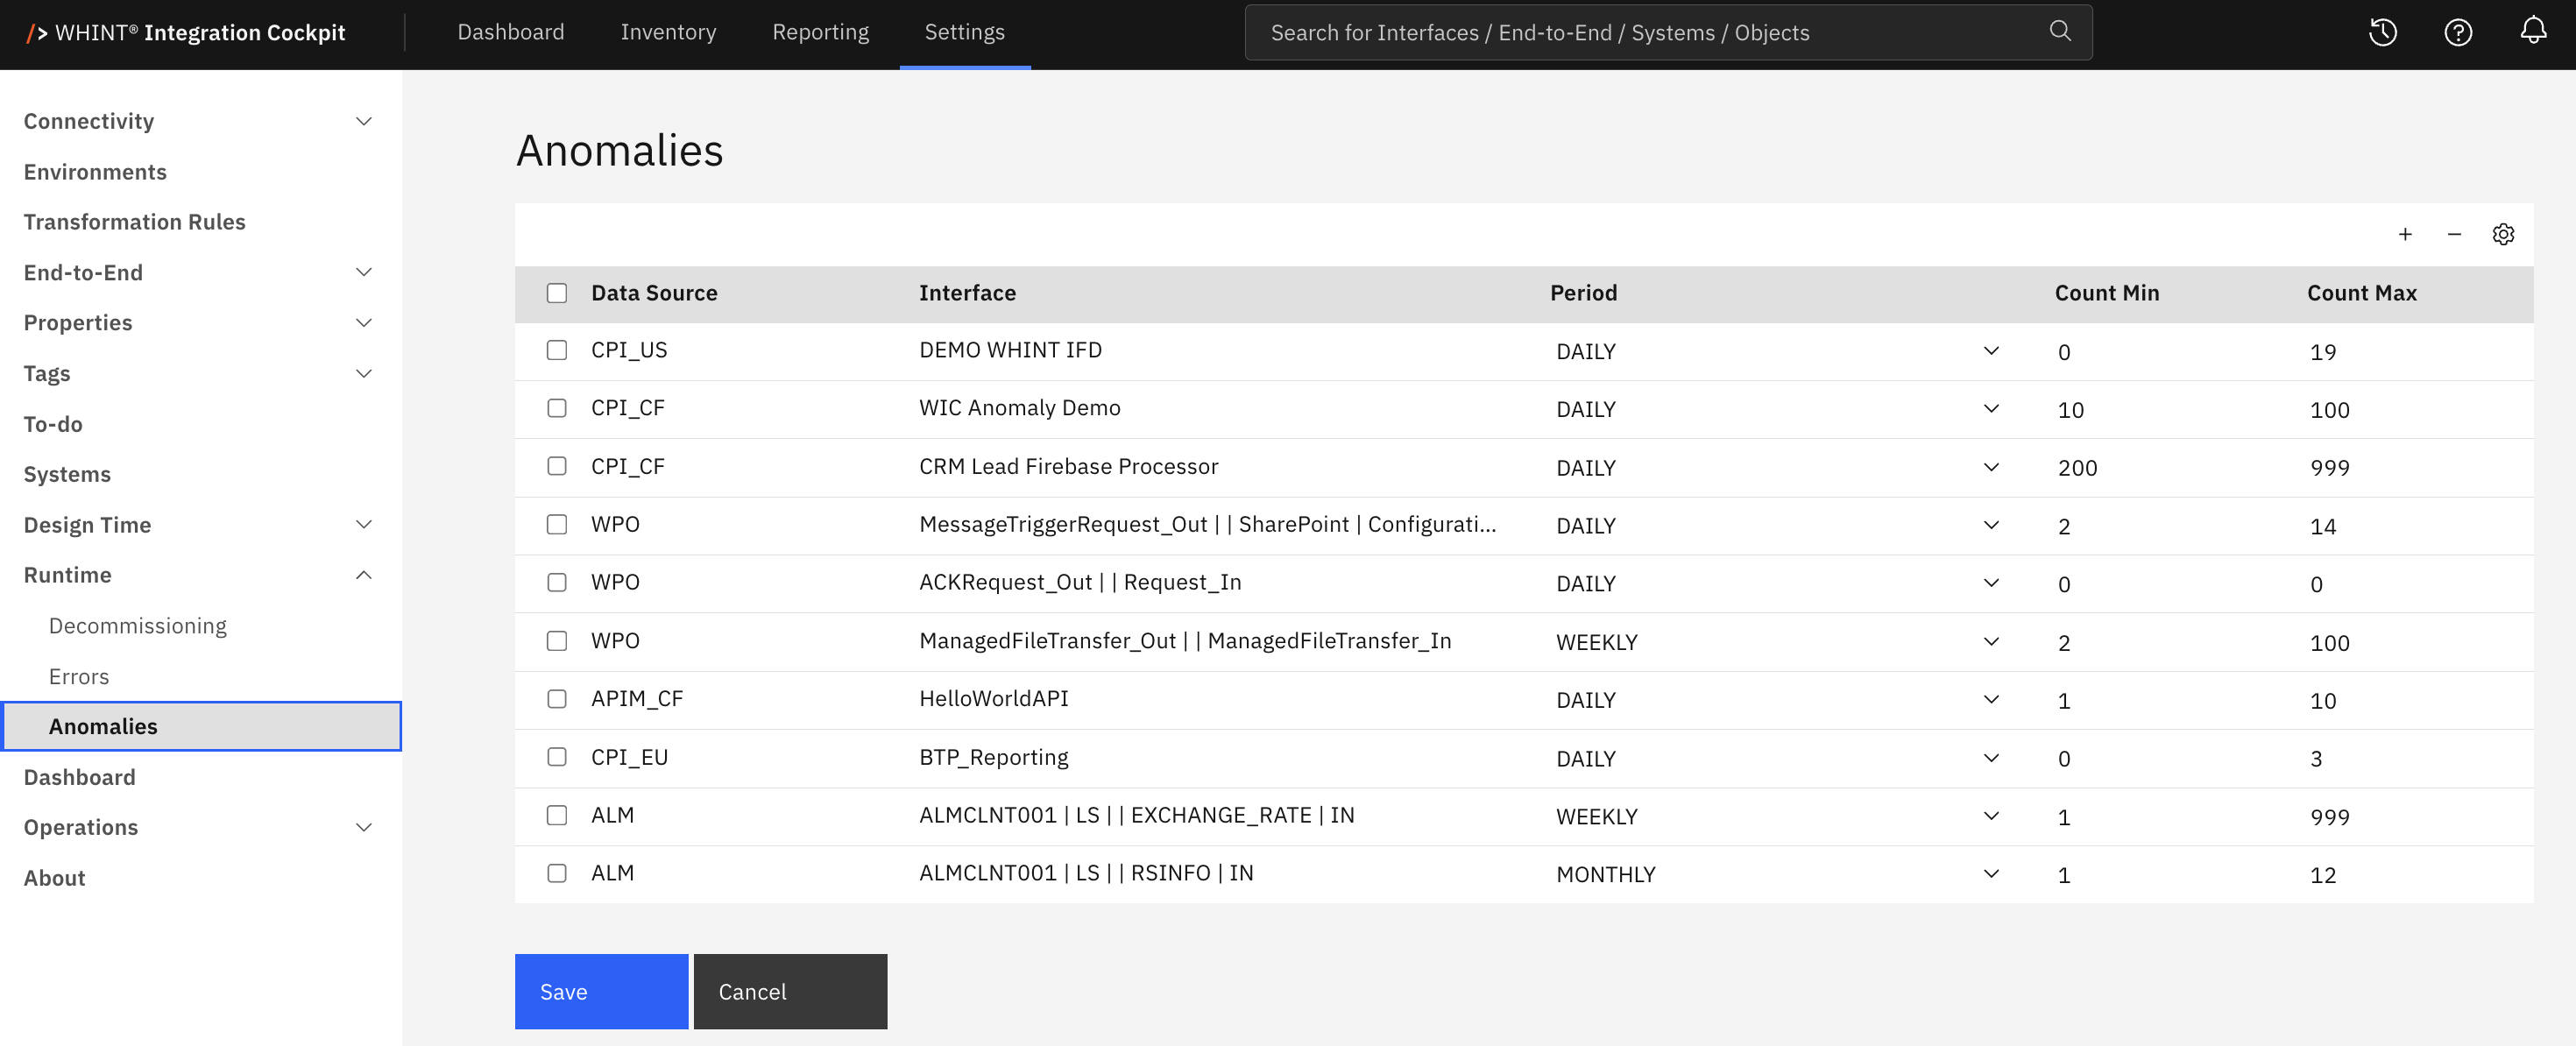
What you see:
-
Data Source – the connection the interface belongs to
-
Interface – the monitored interface
-
Period – the period whose message volume is evaluated
-
Count Min and Count Max – the expected range
-
+ and – – add or remove rules
-
⚙ – open Configure Periods to maintain custom periods
-
Save and Cancel – apply or discard changes
Configuration
Data Source and Interface
-
Select the data source first.
-
The Interface dropdown is then loaded with the interfaces of that connection, sorted alphabetically.
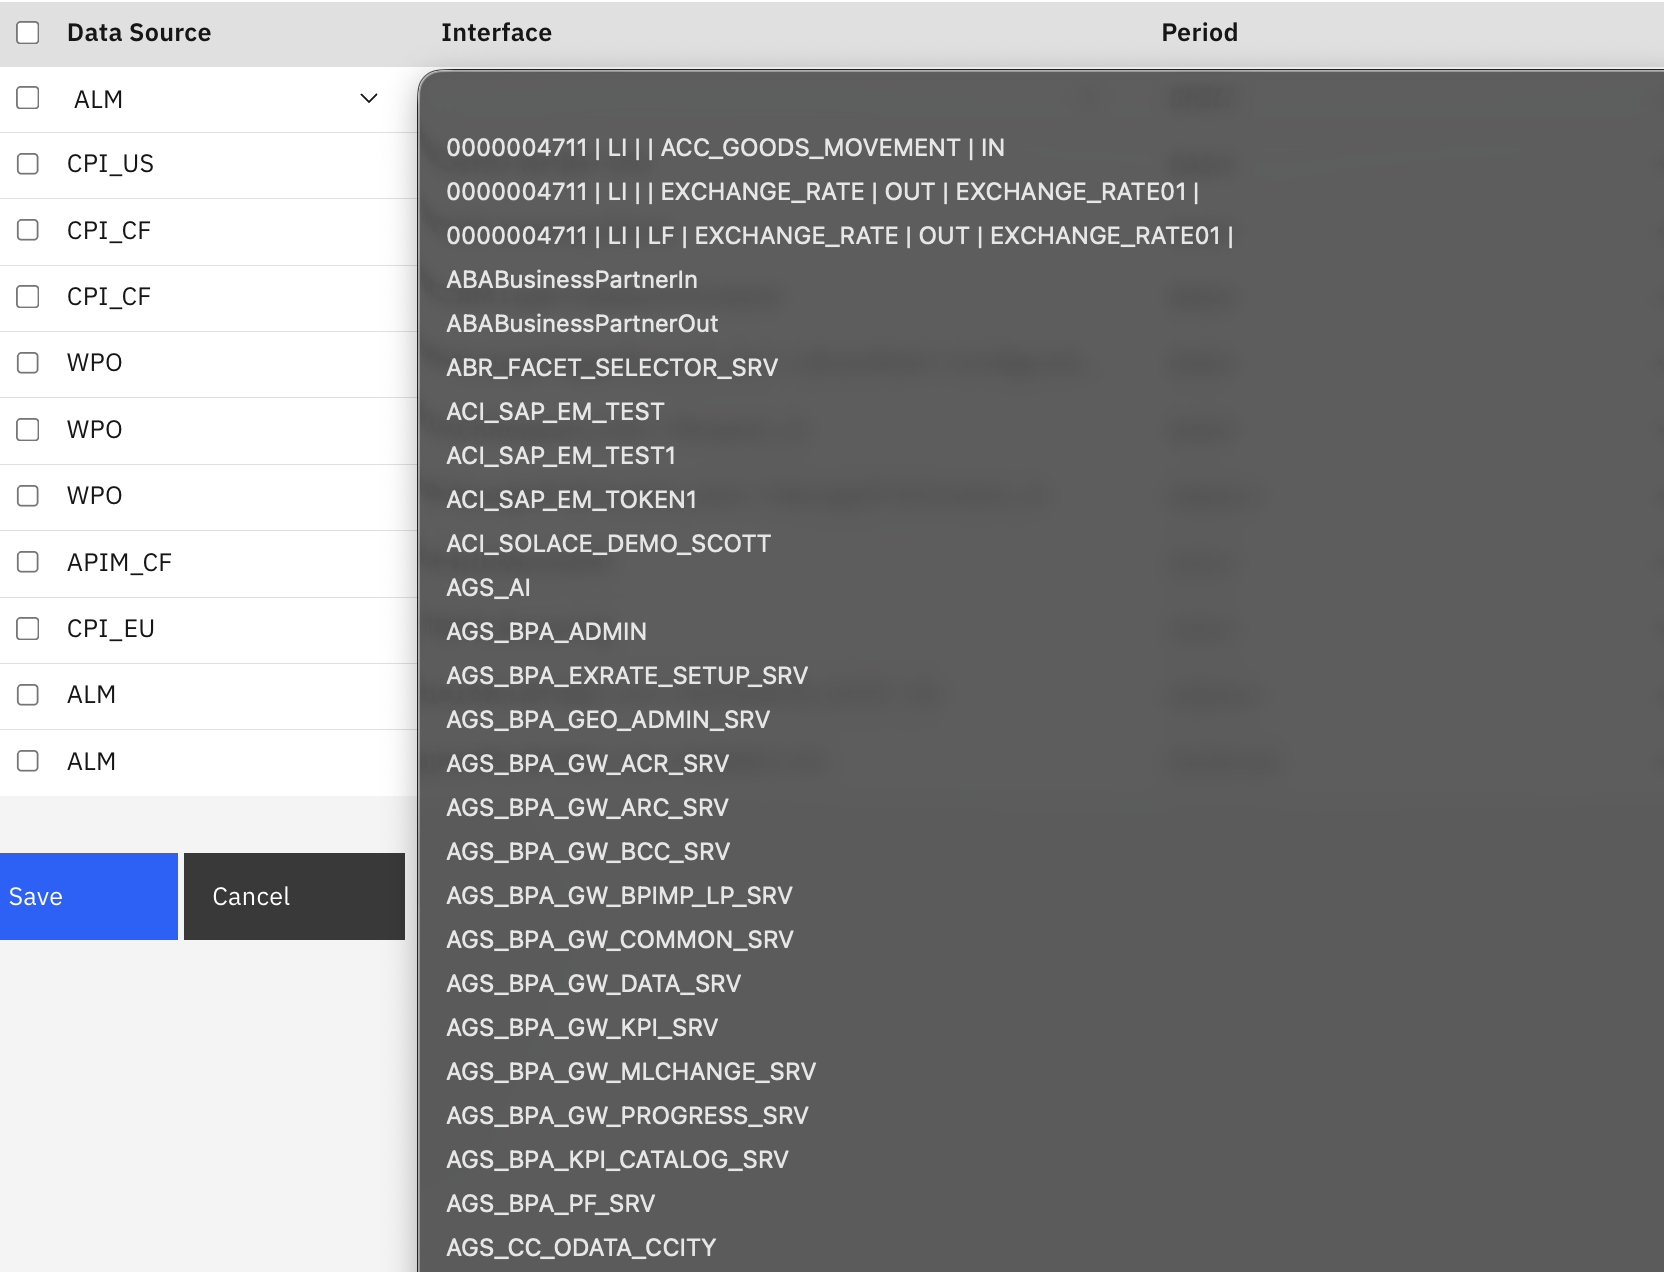
Data Source and Interface can only be set while the row is new. On a saved rule, both are shown as text. To monitor a different interface, remove the rule and create a new one.
A new row can only be added once the previous new row has a data source and an interface.
Period
Standard periods always evaluate the last completed period, in UTC:
|
Value |
Evaluated period |
|---|---|
|
|
Yesterday, the full day |
|
|
The last completed week, Monday to Sunday |
|
|
The previous calendar month |
|
|
Yesterday between 08:00 and 18:00 |
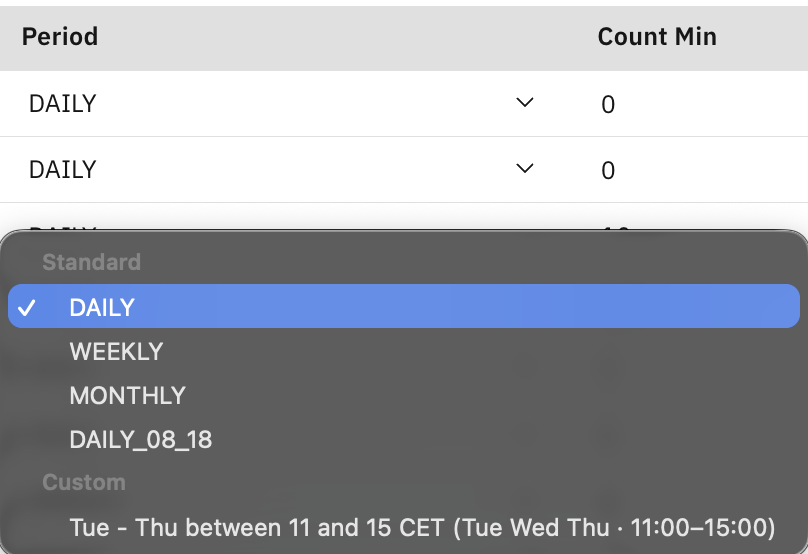
Custom periods appear below the standard ones in the Custom group – see Custom Periods.
Count Min and Count Max
The expected number of messages or calls in that period. The interface is flagged as an anomaly when the actual count is below Count Min or above Count Max. New rows start with 0 in both fields.
A Count Min of 0 never flags an interface that processed nothing. Set it to at least 1 to detect silence. With the initial 0 in both fields, any traffic is flagged because it already exceeds Count Max.
Example: Count Min 10, Count Max 100 with period DAILY flags the interface when yesterday it processed fewer than 10 or more than 100 messages or calls.
Custom Periods
Standard periods cover full days, weeks and months. Use a custom period when an interface only runs on certain weekdays or within a certain time window. The evaluation always covers a single day – the most recent of the selected weekdays.
Click ⚙ in the table header to open Configure Periods.
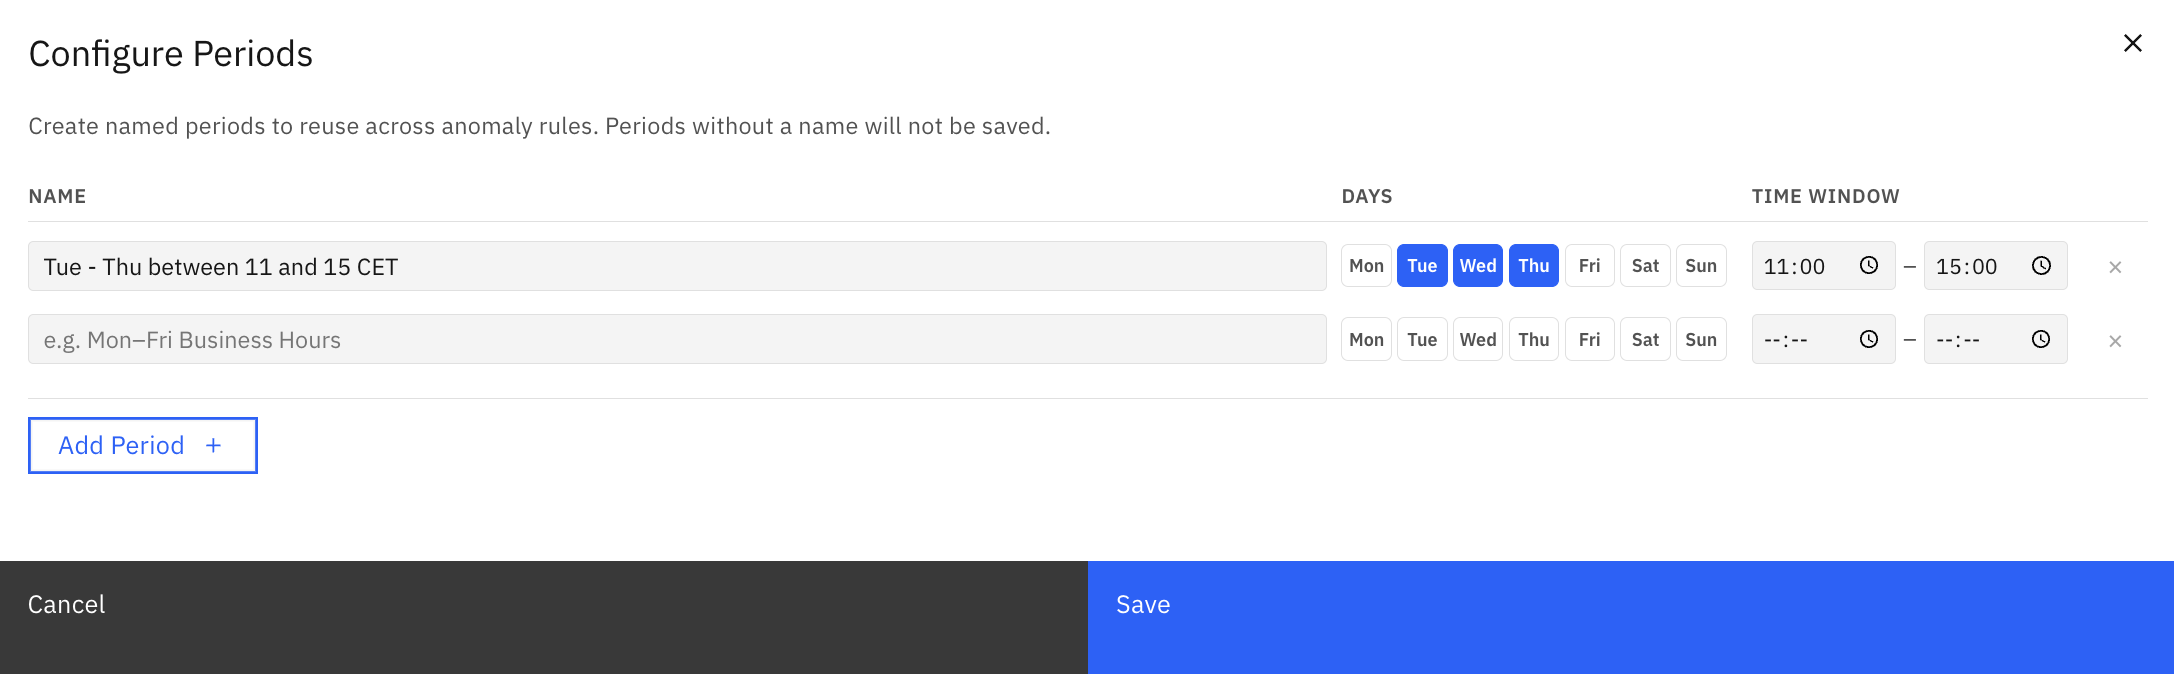
|
Field |
Meaning |
|---|---|
|
Name |
The label shown in the Period dropdown and in the reports. Periods without a name are not saved. |
|
Days |
The weekdays the period applies to |
|
Time Window |
Optional start and end time; without it the whole day is evaluated |
Add Period adds a row, × removes one. A period that is used by at least one rule is marked in use; removing it asks for confirmation, and the rules that used it fall back to the standard period.
A custom period evaluates one single day, and the time window is UTC. The Cockpit walks back from yesterday to the most recent selected weekday and evaluates that day only – it does not add up all selected weekdays. A period with Tue, Wed and Thu selected therefore evaluates whichever of those days came last. Times are interpreted in UTC, regardless of the name given to the period.
Managing Rules
-
Click + in the table header. A new row is added at the top.
-
Select the Data Source, then the Interface, choose the Period and enter Count Min and Count Max.
-
Click Save.
To remove a rule, select its checkbox, click – and then Save.
Cancel discards unsaved changes.
Validation: Data Source and Interface are mandatory in every rule.
Where the Results Appear
-
Reporting → Runtime → Anomalies – one row per rule with interface, data source, period, the evaluated interval, the configured range and the actual count; the actual count is shown in red when it leaves the range and in green when it stays inside
-
Dashboard → Operations – the Anomalies column per data source and interface type, marked red when at least one interface is outside its range; the element must be enabled under Settings → Dashboard
-
Reporting – the same Operations table on the reporting overview page
The evaluation is calculated when the report or dashboard is opened, so configuration changes take effect immediately. The counted volume comes from the traffic data collected from the connection.
Related Documentation
-
Errors – The error counts shown next to the anomalies
-
Dashboard Configuration – Enabling the Operations element
-
Data Sources – Connecting the platforms
Last Updated: September 1, 2026