

The Errors section defines for which data sources and interface types the Cockpit counts runtime errors, and how far back it looks.
Purpose: Runtime errors are only useful if someone sees them without opening every platform. Each configured row shows the number of errors of the last hours on the dashboard and links straight into the traffic report of that connection, down to the individual failed message or call.
Navigate to Settings → Runtime → Errors to configure the error monitoring.
Errors Overview
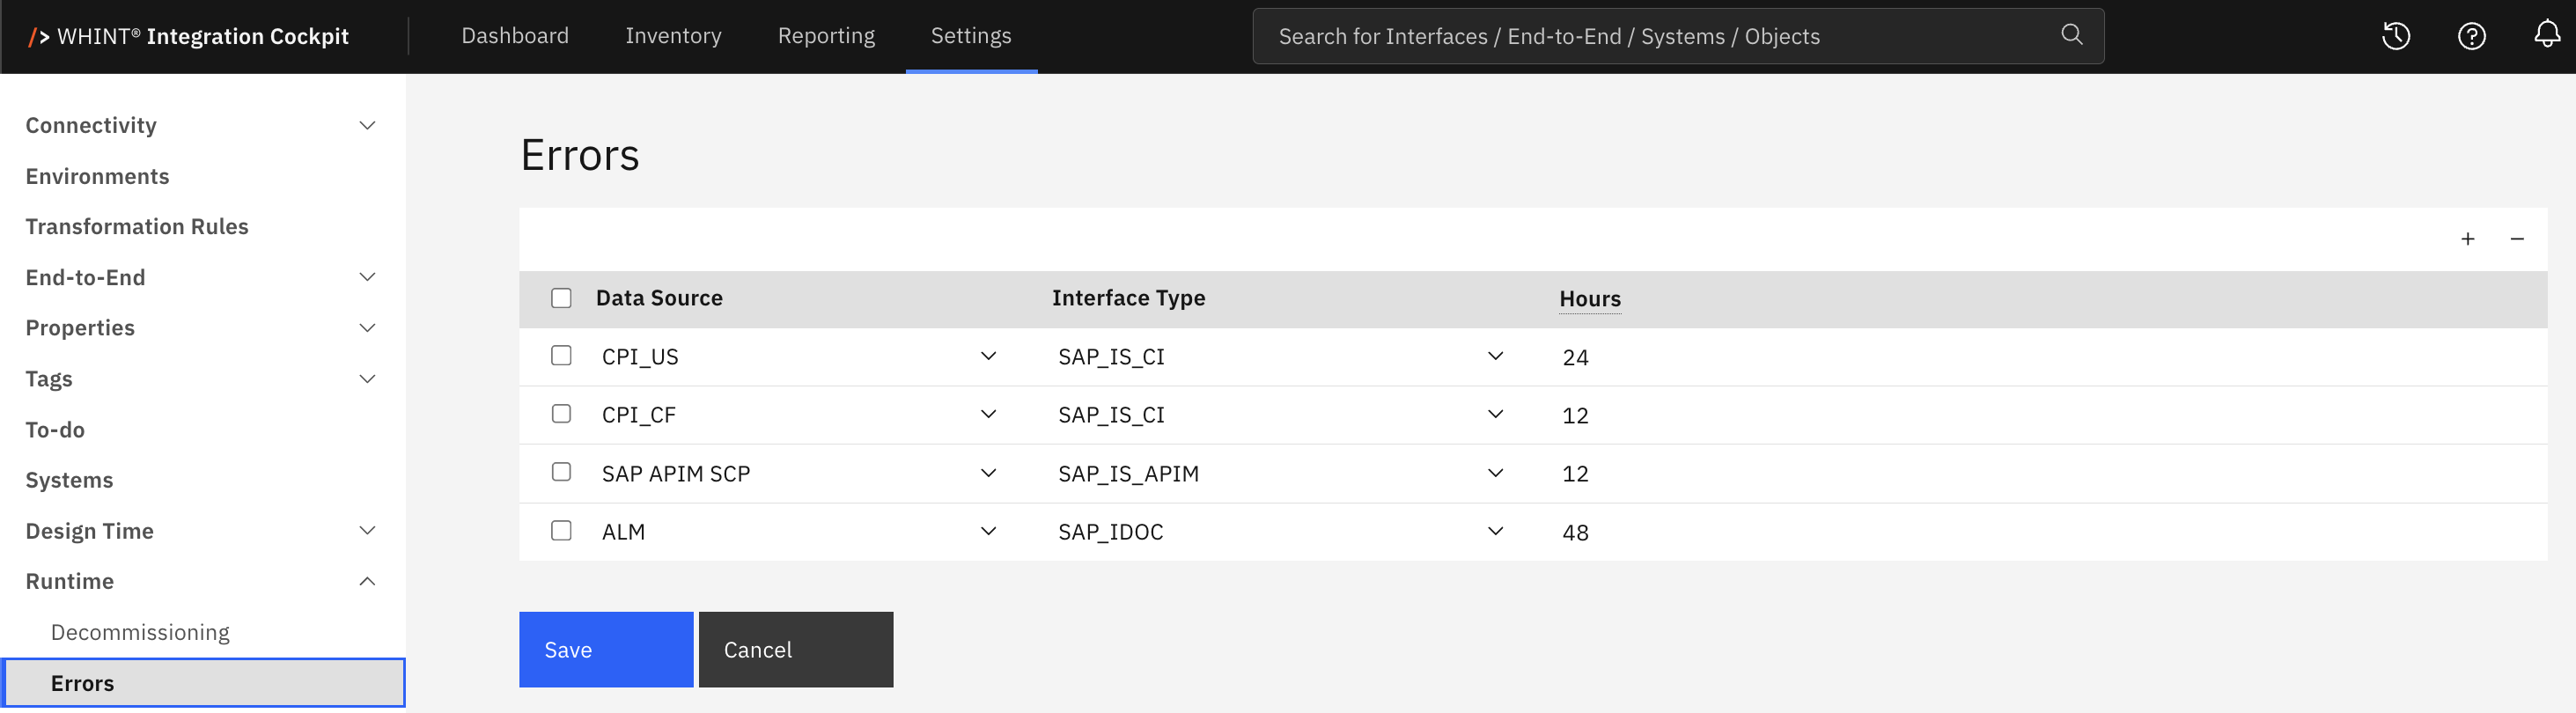
What you see:
-
Data Source – the connection whose errors are counted
-
Interface Type – the technology whose errors are counted
-
Hours – how many hours back from now are considered
-
+ and – – add or remove rows
-
Save and Cancel – apply or discard changes
Configuration
Each row consists of a Data Source, an Interface Type and Hours.
Data Source
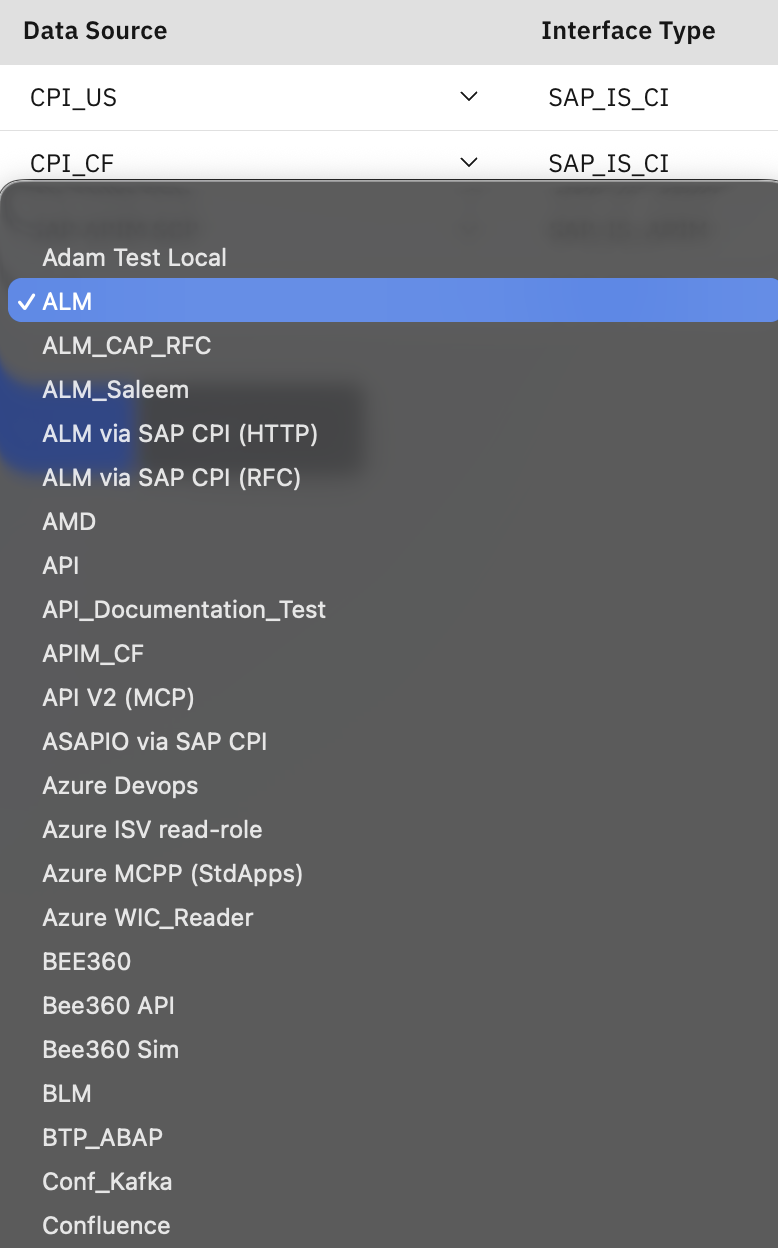
All configured data sources are available, sorted alphabetically by name. The list is not restricted to the selected interface type.
Interface Type
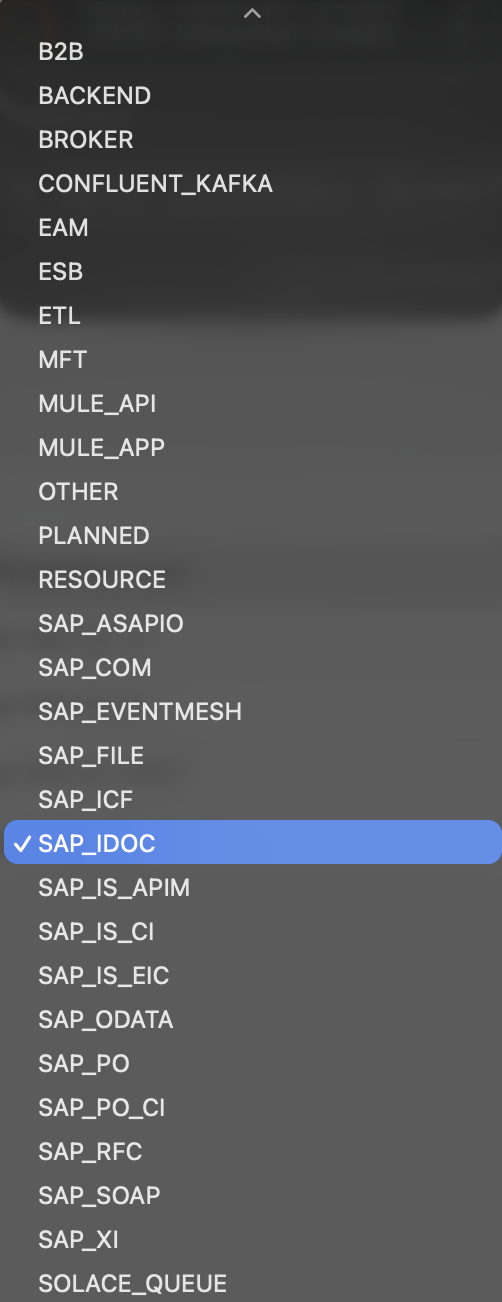
The dropdown lists all interface types known to the Cockpit. Errors are counted for these types:
|
Value |
Errors counted |
|---|---|
|
|
Cloud Integration – failed message processing |
|
|
Edge Integration Cell – evaluated through the Cloud Integration message log |
|
|
API Management – failed API calls |
|
|
SAP ABAP – IDoc errors |
|
|
SAP ABAP – XI message errors |
Make sure the interface type matches the data source: a Cloud Integration row on an ABAP connection is saved but returns no errors.
Hours
The number of hours counted backwards from the moment the report is opened. A value of 24 counts the errors of the last 24 hours. New rows are prefilled with 24.
Enter a plain number. A value that cannot be read as a number stops the whole error evaluation – the Operations table then shows no error counts at all, not just for that row.
Managing Rows
-
Click + in the table header. A new row is added at the top, with Hours prefilled.
-
Select the Data Source and Interface Type, and adjust Hours.
-
Click Save.
To remove a row, select its checkbox, click – and then Save.
Cancel discards unsaved changes.
Validation: Data Source, Interface Type and Hours are mandatory in every row. Nothing is saved as long as a row is incomplete.
Configure one row per data source and interface type. The same combination entered twice is saved, and its errors are counted twice in the Operations table.
Where the Results Appear
-
Dashboard → Operations – one row per data source and interface type with the number of errors and anomalies- the element must be enabled under Settings → Dashboard
-
Reporting – the same Operations table on the reporting overview page
The error count links directly to the traffic report of that connection, where the individual failed messages or calls are listed. The Anomalies column of the same table comes from Settings → Runtime → Anomalies.
Error counts are calculated when the dashboard or the reporting page is opened, so configuration changes take effect immediately. The counted errors come from the traffic data collected from the connection.
Related Documentation
-
Anomalies – Configuring the anomaly detection shown next to the error counts
-
Dashboard Configuration – Enabling the Operations element
-
Data Sources – Connecting the platforms
Last Updated: September 1, 2026